


Russell 2000 Leading The Stock Market Charge Higher
Stock-Markets / Stock Markets 2018 Jun 06, 2018 - 03:12 PM GMTBy: Chris_Vermeulen

 While the US majors continue to push higher through recent price rotation levels, the IWM (Russell 2000 ETF) is showing investors where strength lies in the markets. Recently, we issued a research report showing that a massive dynamic shift is beginning to take place in the US market that provides an incredible opportunity for investors. Now, we have further proof that this shift is well underway and is likely much further along than we initially expected.
The Russell 2000 is one component of the US market that often reacts to market strength and weakness a bit differently than the S&P, DOW or NASDAQ index. The reason for this is that the Russell 2000 index makes up a broader scope of trading symbols that represent a greater chunk of the total market segment. The US majors don’t always follow the Russell 2000, but when the Russell 2000 index breaks recent all-time highs on a broad push higher – we need to pay attention.
Investors need to be very aware that most of the market believes the recent Feb 2018 price rotation setup a completed Elliot Wave 5 TOP. Yet, we believe this analysis is incorrect and we believe the markets are setting up for an extended Wave C or compounded Wave C that will drive market prices much higher over the next few months. The fact that the IWM (Russell 2000) has breached recent all-time highs and is now pushing into uncharted high price territory is critical to our understanding of the future price moves for the US Majors.
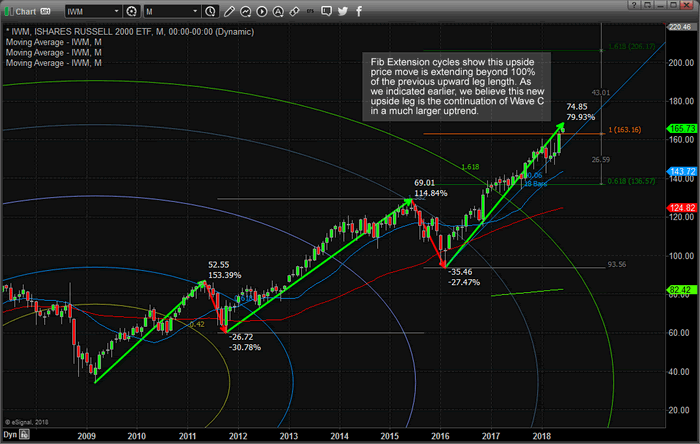
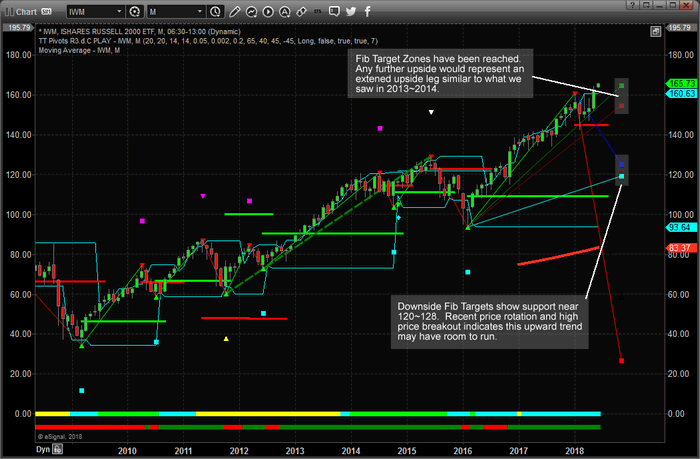
With the Russell 2000 driving upward price action, clearing recent high price peaks and closing May with an incredible upside price move, we look to our advanced price modeling systems to help us understand the potential future price moves. This next chart shows our Fibonacci predictive price modeling system and clearly shows the “Fib Target Zones” near the right side of this chart. Current prices are already near these target zone levels – yet they can extend well beyond these levels when price dynamics “expand”. Therefore, should the upside trend expand as we expect, we believe the upside potential in the IWM to be at least 15~20% higher from these current levels.
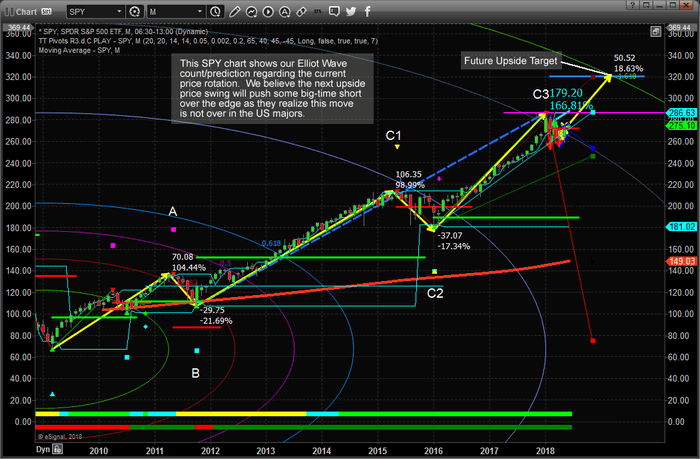
This SPY chart showing our proprietary Fibonacci predictive price modeling system shows what we believe to be the correct Elliot Wave count and shows “C3” where the current price peak/high price rotation exists. We believe this rotation is not a completed wave 5 – but a compound wave C that will continue higher to form a full 5 leg wave C move. If we are correct, this market has at least 15% more to the upside and the S&P and DOW stocks will likely be the big winners in this move.
Our recent analysis suggested that a massive capital shift is taking place in the US markets where the NASDAQ may be nearing a temporary price peak and where the S&P and DOW stocks may still have room to run. This shift indicates that the blue chips and S&P leaders may be the big runners over the summer months. Currently, Russell 2000 leaders may also benefit from this move given this recent research.
You won’t want to miss the opportunities this move presents and the potentially massive “short squeeze” that is setting up. Visit our website to learn how we can help you navigate these markets and stay ahead of the markets to create opportunity. If we are correct, this upside leg will put great pressure on some of the biggest names in the business because they have completely missed this expanded Elliot Wave formation and are shorting the market in the billions. When this breaks, it could break very hard to the upside. Join www.TheTechnicalTraders.com today to take this opportunity and turn it into success.
Our 53 years experience in researching and trading makes analyzing the complex and ever-changing financial markets a natural process. We have a simple and highly effective way to provide our customers with the most convenient, accurate, and timely market forecasts available today. Our stock and ETF trading alerts are readily available through our exclusive membership service via email and SMS text. Our newsletter, Technical Trading Mastery book, and 3 Hour Trading Video Course are designed for both traders and investors. Also, some of our strategies have been fully automated for the ultimate trading experience.
BECOME A PROFITABLE TECHNICAL TRADER TODAY
WITH OUR WEALTH BUILDING NEWSLETTER!
Chris Vermeulen
www.TheTechnicalTraders.com
Chris Vermeulen has been involved in the markets since 1997 and is the founder of Technical Traders Ltd. He is an internationally recognized technical analyst, trader, and is the author of the book: 7 Steps to Win With Logic
Through years of research, trading and helping individual traders around the world. He learned that many traders have great trading ideas, but they lack one thing, they struggle to execute trades in a systematic way for consistent results. Chris helps educate traders with a three-hour video course that can change your trading results for the better.
His mission is to help his clients boost their trading performance while reducing market exposure and portfolio volatility.
He is a regular speaker on HoweStreet.com, and the FinancialSurvivorNetwork radio shows. Chris was also featured on the cover of AmalgaTrader Magazine, and contributes articles to several leading financial hubs like MarketOracle.co.uk
Disclaimer: Nothing in this report should be construed as a solicitation to buy or sell any securities mentioned. Technical Traders Ltd., its owners and the author of this report are not registered broker-dealers or financial advisors. Before investing in any securities, you should consult with your financial advisor and a registered broker-dealer. Never make an investment based solely on what you read in an online or printed report, including this report, especially if the investment involves a small, thinly-traded company that isn’t well known. Technical Traders Ltd. and the author of this report has been paid by Cardiff Energy Corp. In addition, the author owns shares of Cardiff Energy Corp. and would also benefit from volume and price appreciation of its stock. The information provided here within should not be construed as a financial analysis but rather as an advertisement. The author’s views and opinions regarding the companies featured in reports are his own views and are based on information that he has researched independently and has received, which the author assumes to be reliable. Technical Traders Ltd. and the author of this report do not guarantee the accuracy, completeness, or usefulness of any content of this report, nor its fitness for any particular purpose. Lastly, the author does not guarantee that any of the companies mentioned in the reports will perform as expected, and any comparisons made to other companies may not be valid or come into effect.
Chris Vermeulen Archive |
© 2005-2022 http://www.MarketOracle.co.uk - The Market Oracle is a FREE Daily Financial Markets Analysis & Forecasting online publication.