


TASI - Saudi Arabia Stock Index Outlook
Stock-Markets / Saudi Arabia Aug 20, 2018 - 09:41 AM GMTBy: MarketsToday

 Further weakness will confirm bearish outlook for the Tadawul All Share Index (TASI)
TASI (Saudi Arabia stock market) poised to breakdown from large bearish Ascending Wedge pattern.
Weakness apparent over past couple of months and follows a prior advance.
Early bearish signs already triggered.
The first chart below is a monthly chart of the Tadawul All Share Index (TASI) for the Saudi Arabia stock exchange. Over the past several months the index completed a 50% retracement (8,254.05) of the prior long-term decline off the 2014 peak before reaching a three-year high of 8,502.92 last month. At that high the TASI was up 59.6% from the October 2016 low of 5,327.49. That low was the second bottom of a large multi-month double bottom trend reversal pattern that eventually broke out one month later in November 2016. In June of this year the minimum target measured from that pattern was reached at 8,423.89.
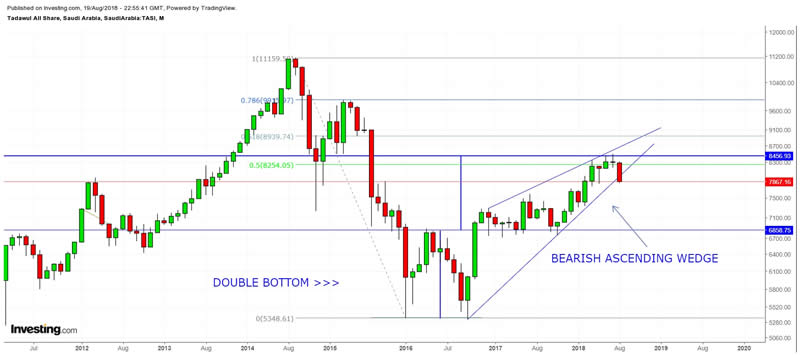
Last month’s candle, which was at the trend high, reflects weakness as the month ended below the 50% level of the month’s high-to-low range and the open and close was close to the same price. This reflects a slowdown in upward momentum and a warning that weakness may be coming. That weakness showed up this month with the TASI falling to a three-month low after breaking below support of the prior two months. This is the first month since November 2017 that the index has fallen below a prior month.
All of the above points to further weakness for the TASI. However, to top it off there is a large bearish ascending wedge that looks poised to breakout to the downside. So far, the uptrend line at the bottom of the wedge has acted as support with the low for the month reached the past several days at 7,826.34. If price keeps falling below May’s low of 7,811.12 (also, a swing low on weekly chart) a breakdown of the wedge will be triggered.
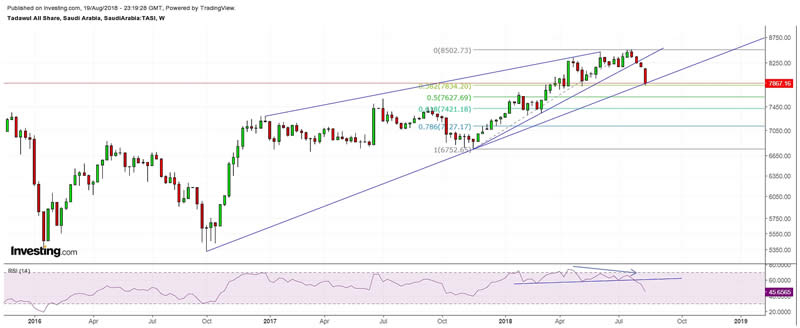
In the weekly chart above we can see that the internal uptrend line has already been broken and the long-term uptrend line is holding as support, right at the same price area as the 38.2% Fibonacci retracement level (7,834.20) of the intermediate-term uptrend. At the same time the 14-week Relative Strength Index (RSI) has turned down after showing bearish divergence.
A decisive breakdown of the bearish wedge will likely see the TASI target the 61.8% Fibonacci retracement at 7,421.18, and certainly the area down to the November 2017 swing low around 6,752.65 is at risk of being tested.
Bruce Powers, CMT
Chief Technical Analyst
http://www.marketstoday.net/
© 2018 Copyright Bruce Powers- All Rights Reserved
Disclaimer: The above is a matter of opinion provided for general information purposes only and is not intended as investment advice. Information and analysis above are derived from sources and utilising methods believed to be reliable, but we cannot accept responsibility for any losses you may incur as a result of this analysis. Individuals should consult with their personal financial advisors.
© 2005-2022 http://www.MarketOracle.co.uk - The Market Oracle is a FREE Daily Financial Markets Analysis & Forecasting online publication.