


Stock Market Update: It's A Trader's World
Stock-Markets / Futures Trading Sep 21, 2008 - 08:39 AM GMTBy: Dominick
 I
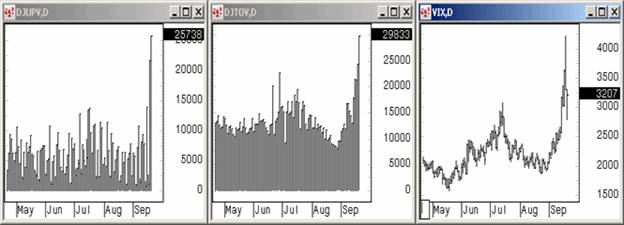
I t's incredible to be living and trading in these historic times which people will be reading and talking about for decades to come. But making some money while we're at it is even better, especially since so many are in the red for this year. Now that we've gotten this huge move of over 120 points off of Thursday's low, we have to respect the rally and expect some follow-through in the short term, even while the choppy, volatile action continues. Looking at some of the internals on this move, shown below, you have to figure there's a good chance that a feel good rally into the election has just begun, an idea we'll be exploring in greater depth this weekend for members only. The charts below show us the extremes that we saw this week in up volume, total volume, and the Vix.

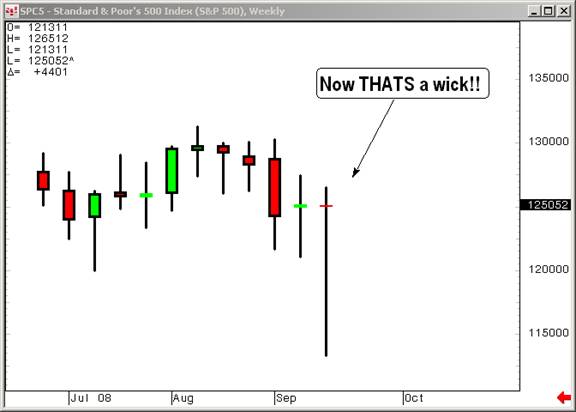
So, the market closed up a few points for the week, but boy does that not even begin to tell the story! Of course the government is going to take all the credit for sparking that huge move on Friday, and others will blame it on the PPT and whatnot, but if that was the whole story, how could I have been looking for a low all week and have a wave count and other evidence that predicted it perfectly? Isn't it more likely the government waited until the bears were too fat and happy, until the rubberband was stretched too far so they could get the most bang for their regulatory buck?
Just like the bull in Jeff Moores graphic at the top of this article, TTC came into last week knowing the crowd was shifted too far to one side. Staying unbiased, we were ready, willing and able to buy that bottom on Thursday and make some good money. Some members made six figures this week as TTC performed exactly as it was meant to, with members working collectively on multiple markets to understand what the market was saying and how best to capitalize.
Yes, we knew the ratings agencies were all of a sudden waking up and doling out long overdue downgrades that triggered cascades of capital-raising exactly as confidence in the financials had deteriorated virtually into nonexistence. We used 1256 on the S&P e-mini futures as a trigger to short a market that was clearly getting panicked, and a confirmation number reserved for members that would get us even more long term bearish.
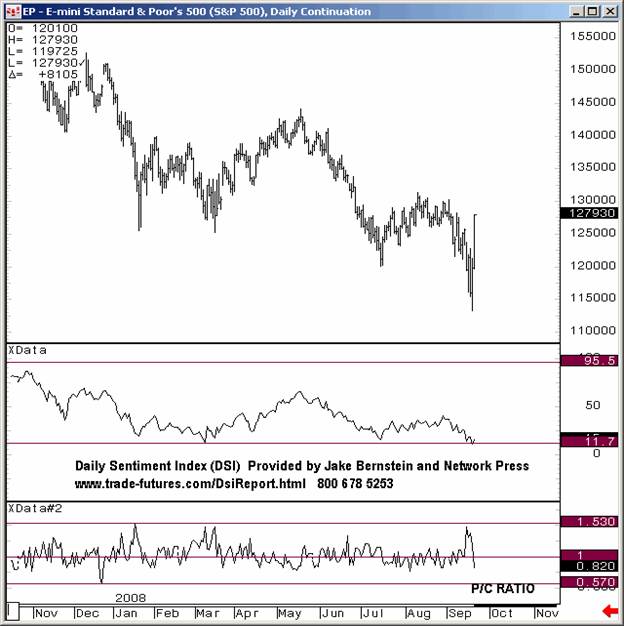
But we also knew it was options expiry week and, if they wanted to, the feds could really stick it to the bears. So it was no time to be pressing your luck on the downside. Wall Street's become more of a casino these days, where the only way to keep your money is to take profits whenever you have them. In fact, as the week progressed, we had a growing pile of evidence suggesting a good bottom was imminent. The first was sentiment, which, as you know, reached epic proportions in its bearishness. The put/call ratio was well into oversold territory. We also had this visual representation of sentiment care of Jake Bernstein's Daily Sentiment Index.
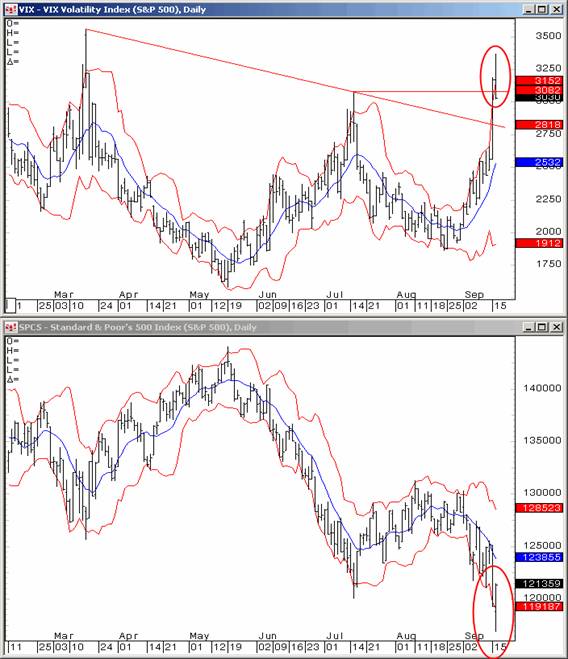
Here's a study in Bollinger bands that worked for us before in the past and worked again last week. The VIX violated the top band as the S&P fell through the bottom, a situation
that usually doesn't last for long without correcting itself. Another clue to a bottom.
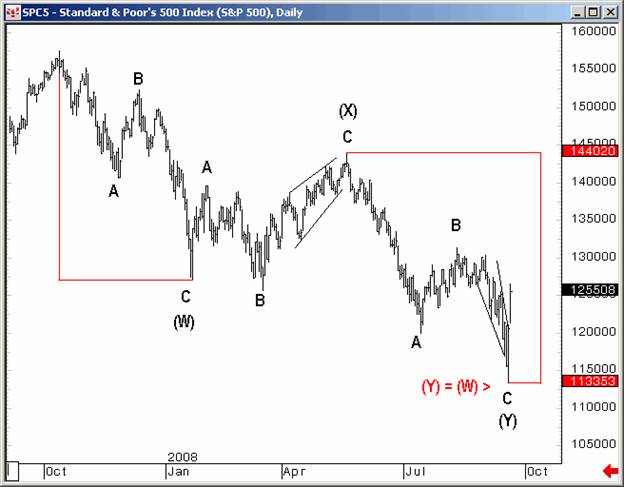
And it certainly didn't hurt to have the correct Elliott wave count! While everyone seemed to be trading the middle third down, expecting a huge crash, we were that one lonely bull watching the chart below, looking for a bottom where Y=W that would have everyone else shorting the hole and then scrambling to cover. If the Fed and the news agencies don't know Elliott wave, they sure have some interesting timing! If you didn't have the chart below for at least an alternate pattern, you have to ask yourself why?
And here below is a chart that was posted as the market was dropping to its lows, again suggesting a bottom with a quick recovery instead of Armageddon and the 1, 2, 1, 2, 1, 2, count the bears kept massaging to fit their bias.
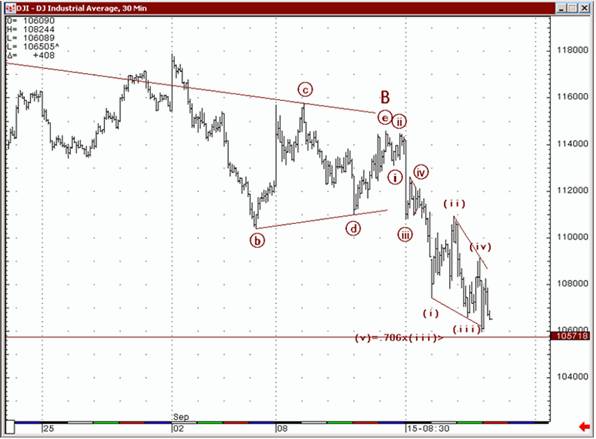
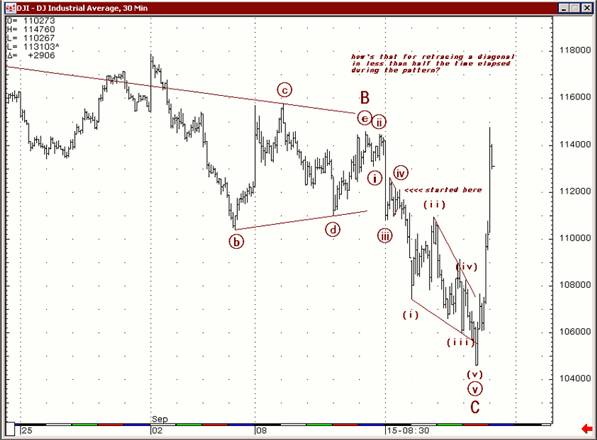
As you know, the market came off those lows like oil on a hot skillet, exactly as it should after an ending diagonal!
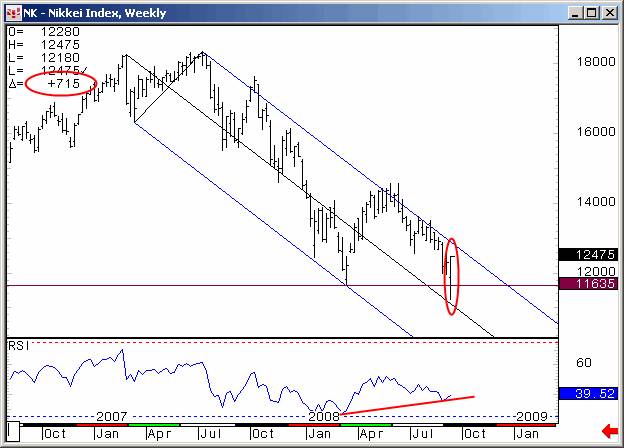
There must be some real ugly stories out there this weekend, of longs on margin getting taken out at the lows, of bears shorting the bottom and waking up to a busted account. But TTC rose to the occasion with some members having their best week ever trading a market that gave huge moves in both directions. And our whole purpose for existing is to cultivate traders. Our real time chat is populated with consummate professionals who, instead of panicking at the lows, were discussing trading vehicles for later in the day, double long S&P ETFs, Rydex Funds, and options. We bought the 1180 October calls that ramped from $31 on Thursday to $100 on Friday's open. And we discussed getting long the Japanese market for overnight, which had also been painting a bottom and would most likely rally off the S&P recovery.
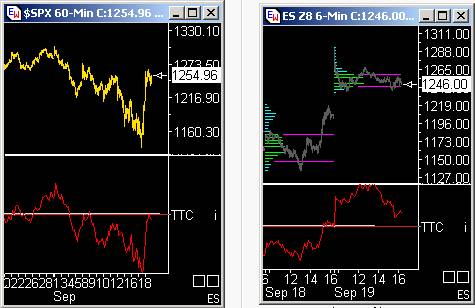
And on Friday morning, we had our proprietary tend cycle charts to navigate the huge volume and momentum that had finally arrived. The chart on the left shows resistance in our 60-minute oscillator, getting us to look for a top to TMAR (take the money and run) against. On the left is the 6-minute chart coming into support later in the day that had us ready to get long for one last ramp job in the final hour.
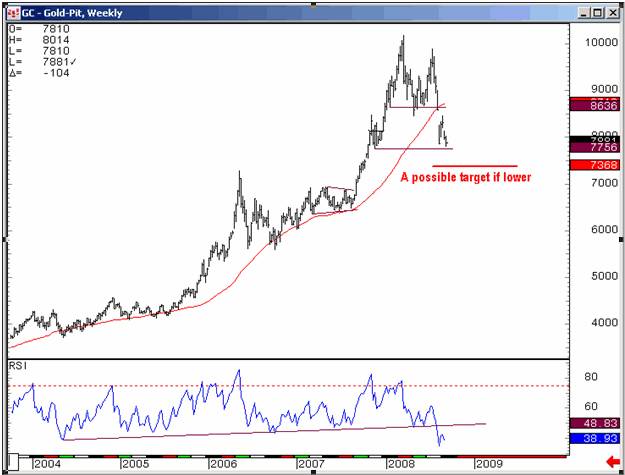
The other big story of the week, of course, was that huge move in precious metals early in the week, which is a perfect example of the alternative markets I'm constantly suggesting members trade since they usually behave much more predictably than the S&P. First, here's an older chart showing two possible targets based on Fibonacci extensions of the previous decline.
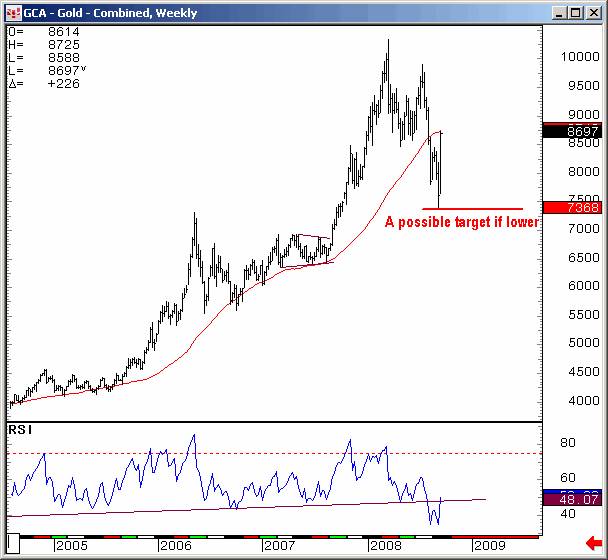
And then here's the after picture with gold launching a record-smashing intraday move of over $100 perfectly off our low target.
So, you can see this is a trader's world, and only the unbiased that move in either direction based on the charts, not the news, are making serious money in this “crisis” environment. But, as I said, you have to respect this rally and how psychology has shifted, even as we continue to get some choppy action in the short term. Having only closed slightly above the previous week, there's still a long way to go before a real recovery is at hand and the bottom confirmed. TTC members still have our critical confirmation level that we wouldn't want to retest if looking for more upside. Break it, and new lows are very likely. But other than that, having been that lonely bull that got in at the bottom, we're happy to have taken profits and not be married to a position, or a bias, going forward.
Have a profitable and safe week trading, and remember:
"Unbiased Elliott Wave works!"
By Dominick , a.k.a. Spwaver
www.tradingthecharts.com
This update is provided as general information and is not an investment recommendation. TTC accepts no liability whatsoever for any losses resulting from action taken based on the contents of its charts, commentaries, or price data. Securities and commodities markets involve inherent risk and not all positions are suitable for each individual. Check with your licensed financial advisor or broker prior to taking any action.
Dominick Archive |
© 2005-2022 http://www.MarketOracle.co.uk - The Market Oracle is a FREE Daily Financial Markets Analysis & Forecasting online publication.