


Breadth is Very Strong While Stocks are Surging. What’s Next for Stocks
Stock-Markets / Stock Markets 2019 Jan 08, 2019 - 10:07 AM GMTBy: Troy_Bombardia

 As the S&P 500 makes a sharp upwards reversal towards its 38.2% fibonacci retracement, the U.S. stock market’s breadth is surging and risk-off assets (USD) are falling.
This combination of extremely strong breadth and a decline in risk-off assets often leads to short term weakness before a bigger medium term rally, but sometimes was a part of V-shaped recoveries. Moral of the story: focus on the medium term instead of the short term. Although V-shaped recoveries are unlikely, there are not impossible.
Go here to understand our fundamentals-driven long term outlook.
Let’s determine the stock market’s most probable medium term direction by objectively quantifying technical analysis. For reference, here’s the random probability of the U.S. stock market going up on any given day.

*Probability ≠ certainty. Past performance ≠ future performance. But if you don’t use the past as a guide, you are blindly “guessing” the future.
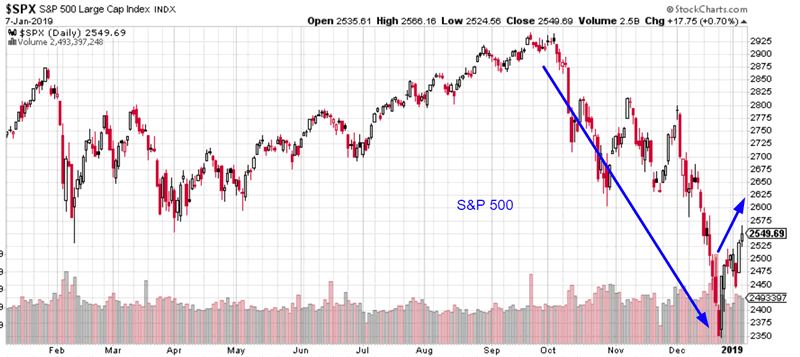
A sharp reversal
The S&P’s decline was sharp, and its rally recently has been equally sharp. Volatility goes in both directions.
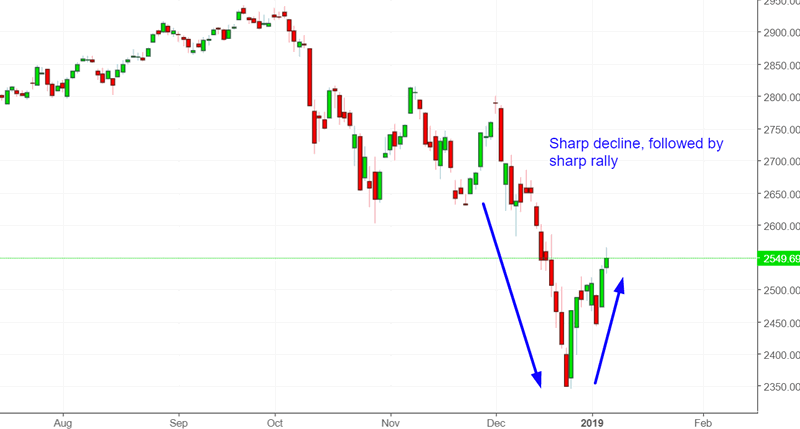
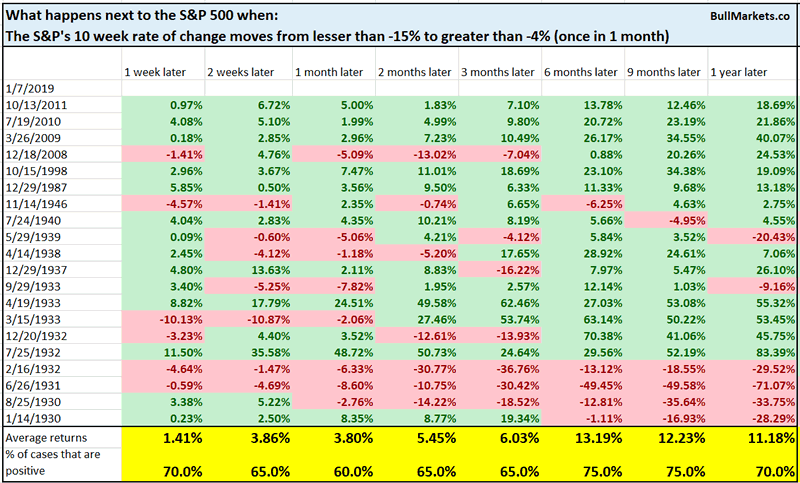
The S&P 500’s 10 week rate-of-change has gone from less than -15% to greater than -4%.
Here’s every single similar case, from 1927 – present
The S&P 500’s pre-1945 data is rather different from post-1950 data. Dividend yields were much higher before the 1950s, which depresses the S&P 500’s nominal price pre-1950s. (In other words, pre-1945 data vs. post-1950 data is an apples vs. oranges comparison). Hence, let’s focus on the post-1950 data
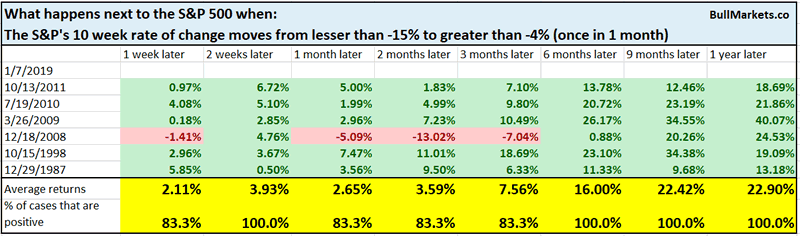
Here, you can see that a V-shaped recovery isn’t impossible.
Macro Context
VIX
VIX mirrors the S&P. While the S&P crashed and rallied, VIX spiked and then fell.
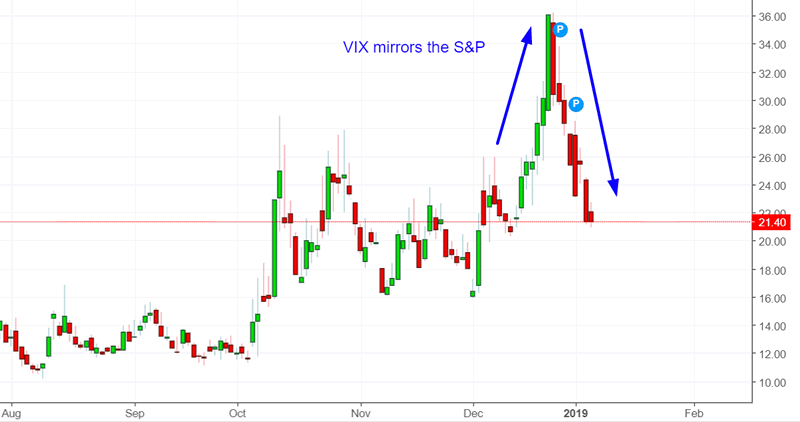
Here’s what happened next to the S&P when VIX’s 10 week rate-of-change went from greater than 85% to less than -15% (a 100% difference)
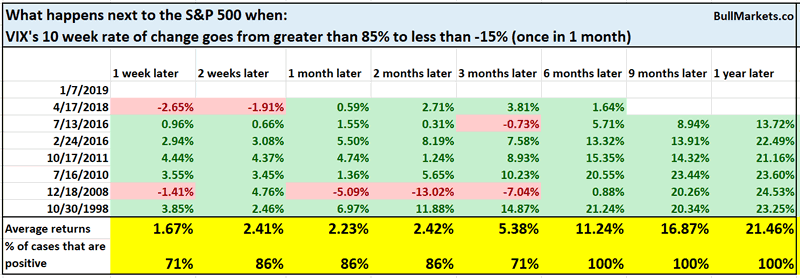
Once again, you can see that a V-shaped recovery isn’t impossible.
What happens next to VIX itself
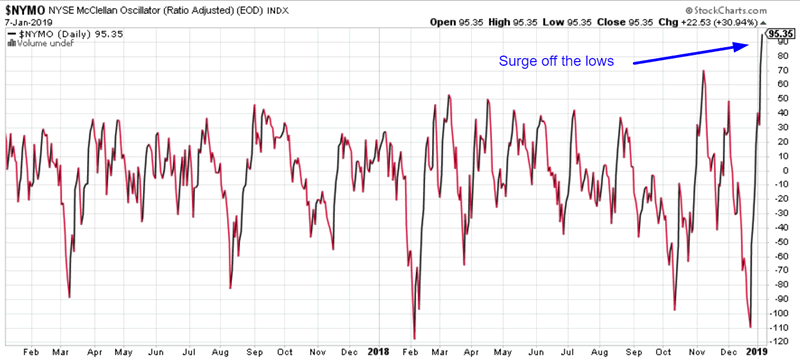
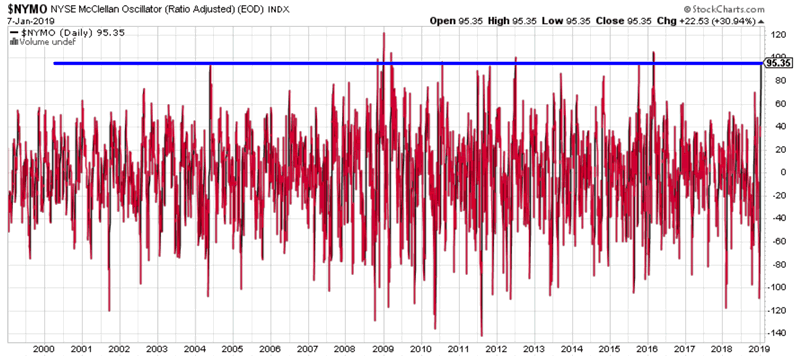
NYSE Breadth surge
The NYSE’s breadth has surged. These surges are normal after post-crash bounces. (Breadth is terrible during the stock market’s crash, and since stock market crashes are followed by equally large rallies, breadth is terrific during the rally).
Here’s what happened next to the S&P when the NYSE McClellan Oscillator exceeded 95
*Data from 1998 – present
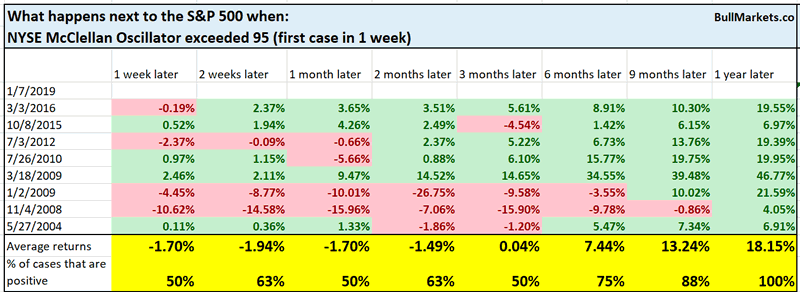
The stock market’s forward returns are mostly random up to the 3 month point, after which it starts to become bullish.
Macro Context
Nasdaq Breadth surge
Similar to the NYSE McClellan Oscillator (NYSE breadth indicator), the NASDAQ McClellan Oscillator (NASDAQ breadth indicator) has surged.
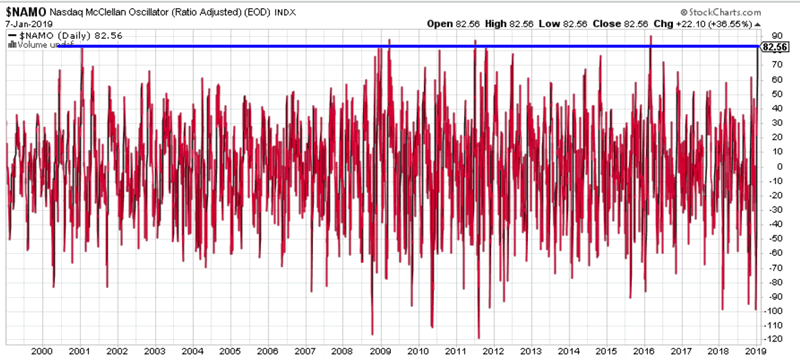
Here’s what happened next to the S&P when the Nasdaq McClellan Oscillator exceeded 80
*Data from 1998 – present
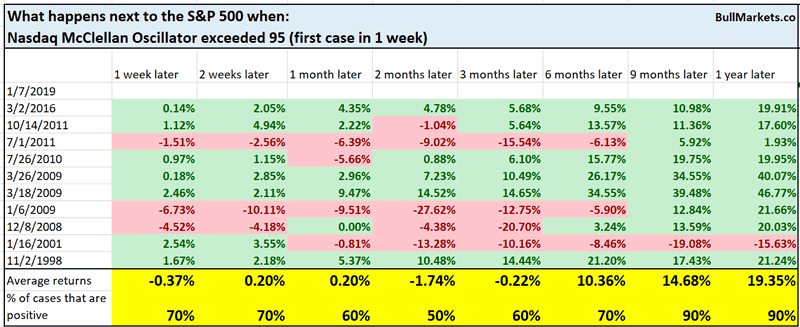
The stock market’s forward returns are mostly random up to the 3 month point, after which it starts to become bullish.
Macro Context
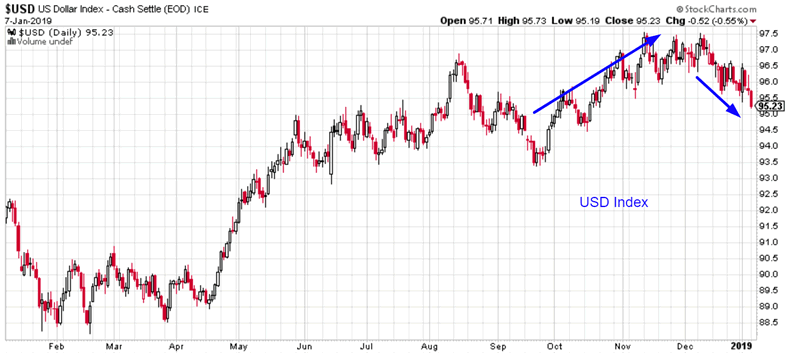
U.S. Dollar safe haven
The U.S. Dollar is frequently traded as a safe haven during times of market stress, which is why it went up in 2008 and 2000-2002.
The U.S. dollar has mirrored the S&P 500 recently
- When the S&P crashed, the U.S. Dollar Index went up
- Now that the S&P is rallying, the U.S. Dollar Index is going down.
Here’s what happened next to the S&P when the S&P’s 10 week rate-of-change went from -13% to -7%, while the USD’s 10 week rate-of-change went from +1% to below 0%
*Data from 1973 – present
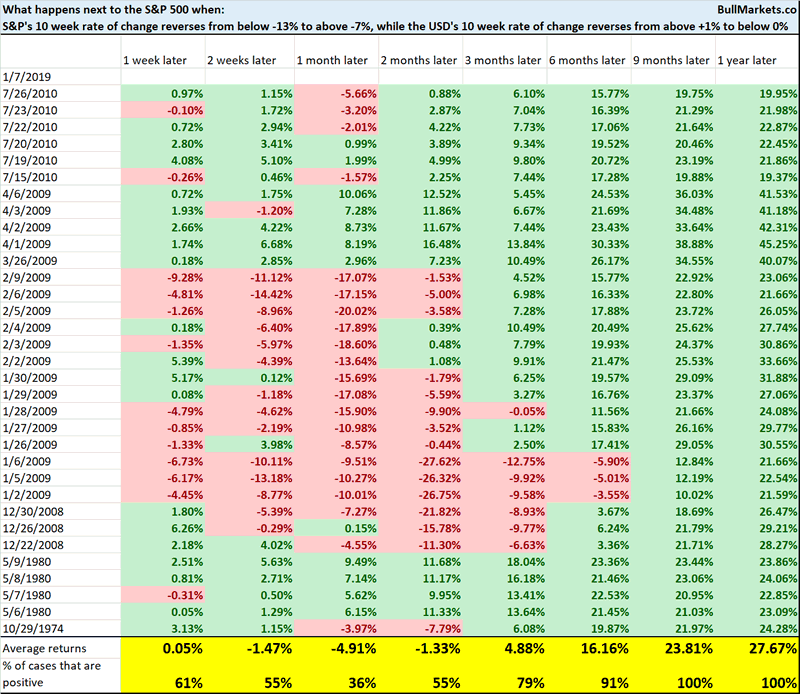
You can see that there are large clusters of cases. Let’s look at the first case in 1 month
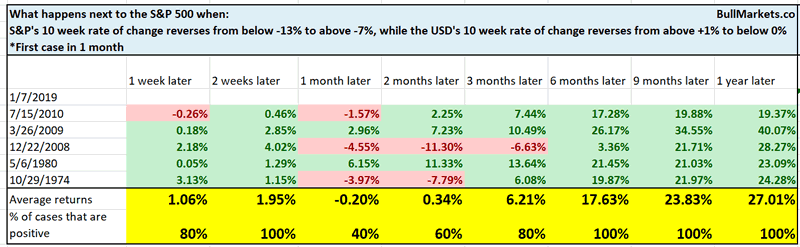
Once again, while the stock market could face short term weakness over the next 1-2 months, after that there was a bigger medium term rally
What this means for the U.S. Dollar
Click here for yesterday’s market study
Conclusion
Here is our discretionary market outlook:
- The U.S. stock market’s long term risk:reward is no longer bullish. This doesn’t necessarily mean that the bull market is over. We’re merely talking about long term risk:reward. Long term risk:reward is more important than trying to predict exact tops and bottoms.
- The medium term direction is still bullish (i.e. trend for the next 6 months). However, if this is the start of a bear market, bear market rallies typically last 3 months. They are shorter in duration.
- The stock market’s short term has a slight bearish lean. Focus on the medium-long term because the short term is extremely hard to predict.
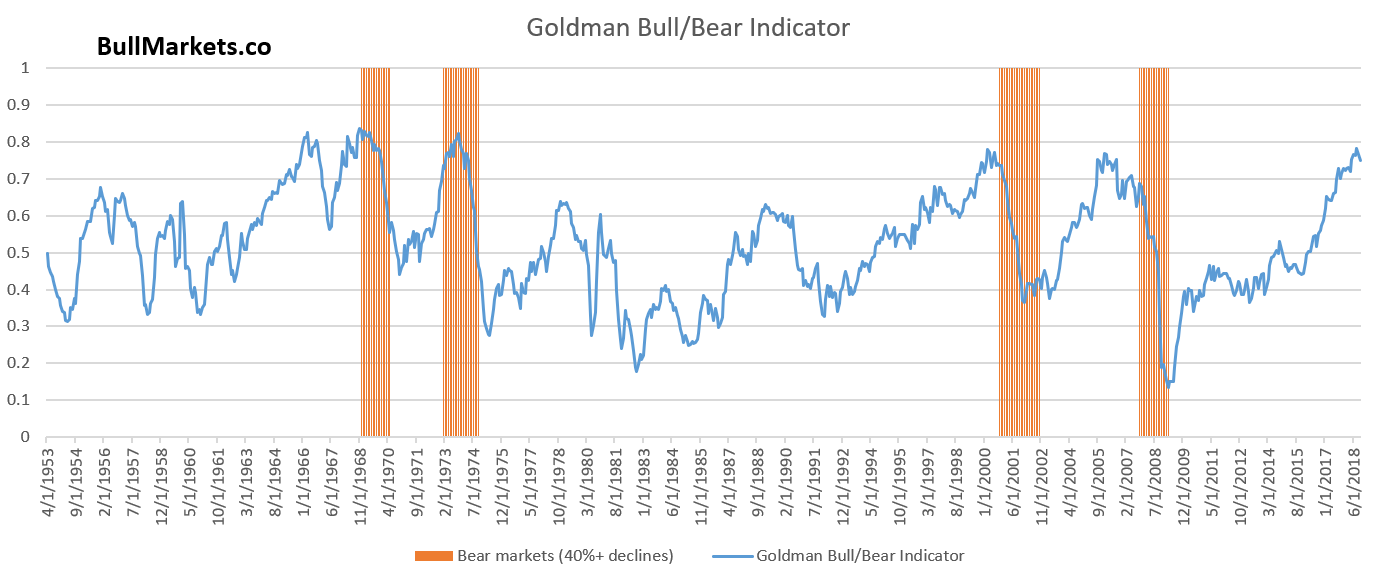
Goldman Sachs’ Bull/Bear Indicator demonstrates that while the bull market’s top isn’t necessarily in, risk:reward does favor long term bears.
Our discretionary outlook is not a reflection of how we’re trading the markets right now. We trade based on our quantitative trading models.
Members can see exactly how we’re trading the U.S. stock market right now based on our trading models.
Click here for more market studies
By Troy Bombardia
I’m Troy Bombardia, the author behind BullMarkets.co. I used to run a hedge fund, but closed it due to a major health scare. I am now enjoying life and simply investing/trading my own account. I focus on long term performance and ignore short term performance.
Copyright 2019 © Troy Bombardia - All Rights Reserved
Disclaimer: The above is a matter of opinion provided for general information purposes only and is not intended as investment advice. Information and analysis above are derived from sources and utilising methods believed to be reliable, but we cannot accept responsibility for any losses you may incur as a result of this analysis. Individuals should consult with their personal financial advisors.
© 2005-2022 http://www.MarketOracle.co.uk - The Market Oracle is a FREE Daily Financial Markets Analysis & Forecasting online publication.