


How to Spot A Tradable Stock Market Top?
Stock-Markets / Stock Markets 2019 Jan 08, 2019 - 04:44 PM GMTBy: Chris_Vermeulen

 If you are a long-term investor, swing trader, or day trader, then you could find one or all of the charts below interesting. What I am going to briefly cover and show you could make you think twice about how you are investing and trading your money.
I will be the first to admit you should not, and cannot, always pick market tops or bottoms, but there are certain times when it’s worth betting on one.
Below I have shared three charts, each with a different time frame using daily, 30 minutes, and a 10-minute chart. Each chart also has a different technical analysis technique and strategy applied.
Each shorter time frame chart as we work down the page zooms in closer to more imminent price action that should take place over the next few days.
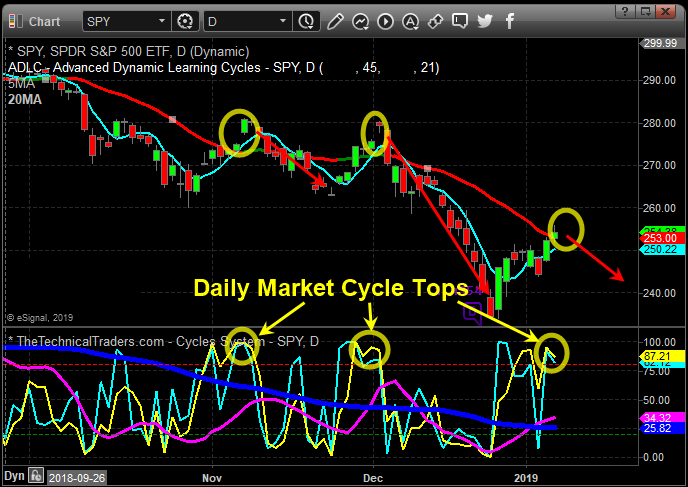
Daily Chart Signals Market Top – Investing/Swing Trading
The daily chart below shows a clear overall trend which is to the downside. Trends are more likely to continue than they are to reverse, hence the saying “The Trend Is Your Friend.”
A key piece of data on this chart is the blue investing cycle line at the bottom. If this is trending down or below the 50 level, then money should be focused on profiting from falling prices via inverse ETF’s, short selling, or put options.
Equally important are the yellow and baby blue cycle lines at the bottom. When these enter the upper reversal zone, we should expect sellers to step into the market and for the price to fall.
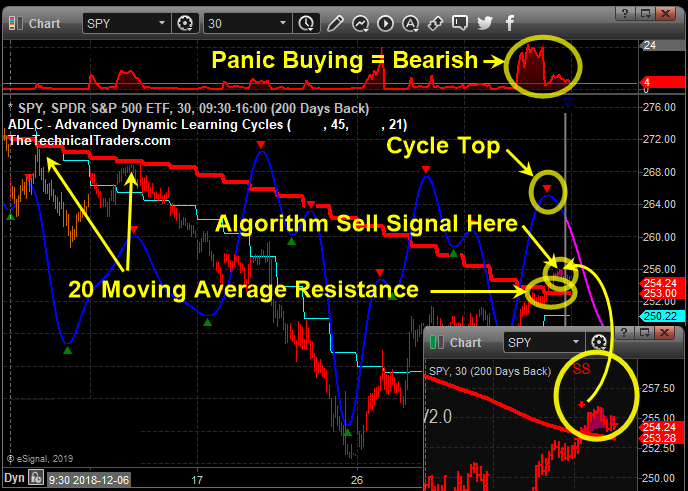
30-Minute Chart Signals Market Top – Swing/Momentum Trading
I apologize for the noisy chart below, a lot is going on there, but if you focus on the yellow text and drawings, it will help keep things simple.
This chart shows several reasons why we expect the price to fall. Based on technical and statistical analysis this chart points weakness over the next 1-3 trading days.
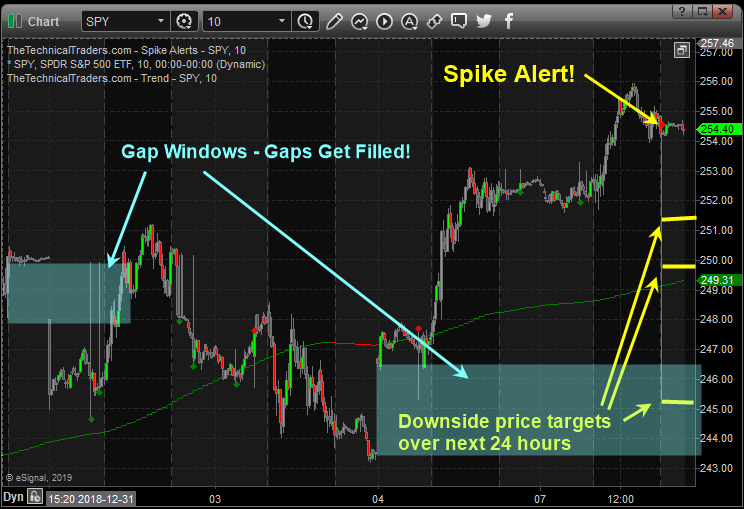
10-Minute Chart Signals Market Top – Momentum/Day Trading
Monday night (Jan 7th) after the closing bell the SPY ETF chart generated a sizable price spike to the downside. Those of you who follow our spikes and or at least know about these setups then you know we expect the price to reach at least one if not all spike targets which are 30%, 50%, and 100% of the spike within 36 hours.
So far in 2019 we have has six price spikes five winners, one loser which is an 83% win rate thus far. Today’s spike is abnormally large not sure what that means regarding this one being a success but it is another spike signal, and the odds favor a move down once you see the other analysis supporting this setup.
Watch the video on how we trade price spikes: https://www.youtube.com/watch?v=jq-SrF-B8MU
Conclusion:
In short, 12 months I publically posted a 31-minute video on the stock market explain how 2018 would be wild and how the stock market should top out which it confirmed this a week ago when the December monthly stock market chart closed below critical support. The video goes on to explain how 2019-2020 will most likely be a bear market and economic recession, and that is exactly what looks and feels like is starting to unfold behind the scenes.
If you are boring long-term investor and have been stuck having to ride the stock market rollercoaster with your life savings my trading newsletter can help you with your long-term portfolio to not only avoid losses but profit from the collapse with one simple inverse exchange-traded fund which trades like a stock and you buy and sell it at anytime! Knowing when you put your nest egg to work, and when to back away and protect it is crucial if you want to become wealthy or become wealthy.
On the flip side, if you are an active trader looking for monthly trades then be sure to join the Wealth Building Newsletter today and receive my daily pre-market video analysis, so you understand what took place yesterday, during overnight trading, and what to expect when the market opens.
Subscribe today and become part of our trading community and prosper from the coming market correction and real-estate downturn.
Chris Vermeulen
www.TheTechnicalTraders.com
Chris Vermeulen has been involved in the markets since 1997 and is the founder of Technical Traders Ltd. He is an internationally recognized technical analyst, trader, and is the author of the book: 7 Steps to Win With Logic
Through years of research, trading and helping individual traders around the world. He learned that many traders have great trading ideas, but they lack one thing, they struggle to execute trades in a systematic way for consistent results. Chris helps educate traders with a three-hour video course that can change your trading results for the better.
His mission is to help his clients boost their trading performance while reducing market exposure and portfolio volatility.
He is a regular speaker on HoweStreet.com, and the FinancialSurvivorNetwork radio shows. Chris was also featured on the cover of AmalgaTrader Magazine, and contributes articles to several leading financial hubs like MarketOracle.co.uk
Disclaimer: Nothing in this report should be construed as a solicitation to buy or sell any securities mentioned. Technical Traders Ltd., its owners and the author of this report are not registered broker-dealers or financial advisors. Before investing in any securities, you should consult with your financial advisor and a registered broker-dealer. Never make an investment based solely on what you read in an online or printed report, including this report, especially if the investment involves a small, thinly-traded company that isn’t well known. Technical Traders Ltd. and the author of this report has been paid by Cardiff Energy Corp. In addition, the author owns shares of Cardiff Energy Corp. and would also benefit from volume and price appreciation of its stock. The information provided here within should not be construed as a financial analysis but rather as an advertisement. The author’s views and opinions regarding the companies featured in reports are his own views and are based on information that he has researched independently and has received, which the author assumes to be reliable. Technical Traders Ltd. and the author of this report do not guarantee the accuracy, completeness, or usefulness of any content of this report, nor its fitness for any particular purpose. Lastly, the author does not guarantee that any of the companies mentioned in the reports will perform as expected, and any comparisons made to other companies may not be valid or come into effect.
Chris Vermeulen Archive |
© 2005-2022 http://www.MarketOracle.co.uk - The Market Oracle is a FREE Daily Financial Markets Analysis & Forecasting online publication.