


Could Gold Rally Above $3750 Before December 2019?
Commodities / Gold & Silver 2019 Jun 08, 2019 - 03:56 PM GMTBy: Chris_Vermeulen

 We asked our researchers a question recently, “Could Gold rally above $3750 before the end of 2019?”. We wanted to see what type of research they would bring to the table that could support a move like this of nearly 200% from current levels. We wanted to hear what they thought it would take for a move like this to happen and if they could support their conclusions with factual conjecture.
Now we ask you to review these findings and ask yourself the same question. What would it take for Gold to rally above $3750 (over 200% from current levels) and why do you believe it is possible?
Our research team came to two primary conclusions in support of a Gold price move above $3750 :
A) The US Presidential election cycle/political environment could prompt a vicious global economic contraction cycle of fear and protectionist consumer and corporate activity that propels the global economy into a deflationary (mini-crisis) event.
B) The global trade wars could complicated item A (the US Presidential election cycle) and create an accelerating component to this global political event. The result is the mini-crisis could turn into “ a bit more” than a mini-crisis if the global trade wars prompt further economic contraction and disrupt global economic activities further.
Our research team suggested the following as key elements to watch out for in terms of “setting up the perfect storm” in the global markets.
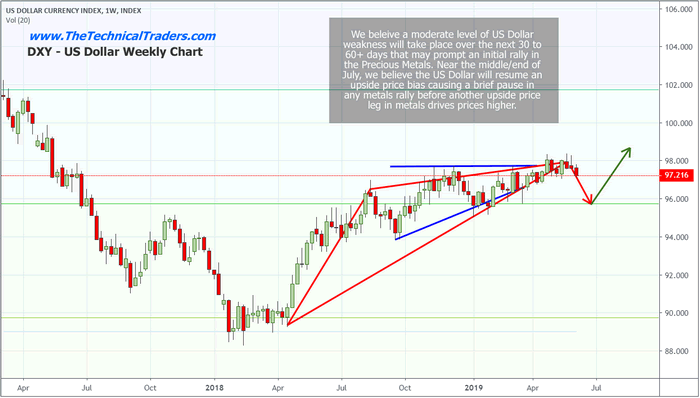
A) The US Dollar falls below $94 and continues to push a bit lower. This would show signs that the US Dollar is losing strength around the world
B) The Transportation Index falls below $4350 and begins a bigger breakdown in price trend – targeting the $3000 level. This would indicate that global trade and transportation is collapsing back to 2007-08 levels.
C) Oil collapses below $45 would be a certain sign that global Oil demand has completely collapsed and the sub-$40 level would very quickly come into perspective as a target.
D) Global Financial stability is threatened by Debt/Credit issues while any of the above are taking place. Should any of the A, B or C items begin to take form over the next few weeks or months while some type of extended debt or credit crisis event is unfolding, it would add a tremendous increase of fear into the metals markets.
Our researchers believe the US Dollar is safe above the $91 level throughout the end of 2019 and that any downside risk to the US Dollar would come in brief price rotations as deflationary aspects of the global economy are identified. In other words, at this time, we don’t believe the US Dollar will come under any severe downside pricing pressures throughout the end of 2019. We do believe a downside price move in the US Dollar may be setting up between now and early July 2019, but we strongly believe the $91 to $93 level is strong support for the long term.
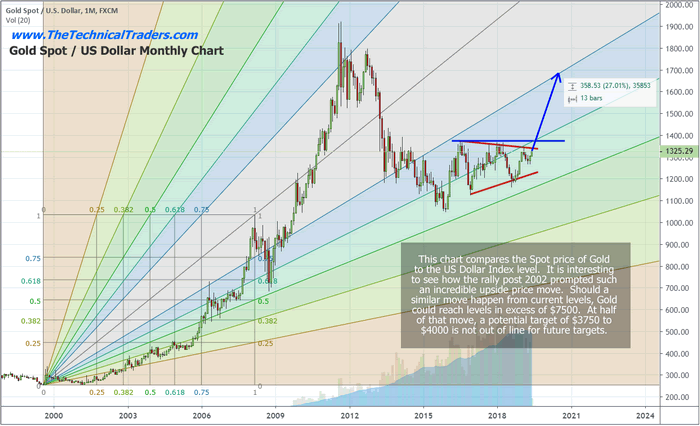
The Gold Spot price / the US Dollar price chart highlights the incredible upside price move in Gold after 2001-02. It was almost a perfect storm of events that took place after this time to prompt a move like this to the upside. Not only did we have multiple US based economic crisis events, we also had a series of global economic “shifts” taking place where capital and assets were migrating all across the globe searching for superior returns. Could this happen again?? Of course it could. Although, we believe the next move in precious metals will be met with a completely different set of circumstances – very likely targeting foreign nations and not the US economy.
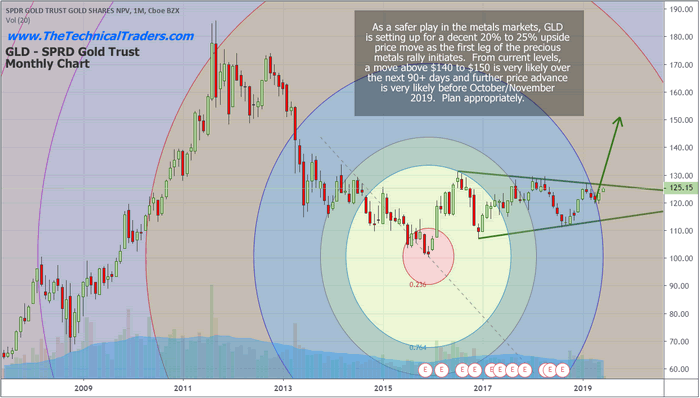
This SPDR GLD chart shows a moderately safer play for investors and traders. The potential for a 20%+ upside price move over the next 60+ days is quite likely and our belief is that traders should be able to trade GLD throughout many of the upside and downside price rotations over the next few weeks and months. Ultimately, if you are skilled enough to pick proper entries, a decent trader could focus on GLD and pick up 65% to 120% ROI over a 7 to 12 month span of time.
– Our Last Gold Forecast From October 2018 Unfolding Perfectly –
Pay attention to where the opportunities are for your level of skill and capital. As we’ve been saying for many months, 2019 and 2020 will be fantastic years for active traders. Stick with what you can execute and trade well because there will be dozens of trades available to most traders over the next 16+ months.
Overall, our research team believes that precious metals have just begun to move higher on a WAVE C impulse move. We authored a research post suggesting that Gold and Silver were currently 20 to 30% undervalued back in late May 2019. The current upside move in Gold and Silver may be just the beginning of a much bigger move.
Ideally, we believe this initial impulse move will end above $1650. From these current levels, that reflects a 25% to 30% upside move in GLD. If any of the fear-inducing items, listed above, begin to take shape over the next 12+ months, we could certainly see Gold above $2100 before too long. $3750 may seem like “shooting for the stars”, but all it takes is a combination of fear and deflation/inflation to drive investors into a gold-hoarding mode just like we saw after 2003-2004 – and that move prompted a 500% price rally from the $300 base level. That same move today would put the current price of Gold near $7800. It might seem like it could never happen – but it could.
Bottom line, we forecast the markets and share some extreme analysis like this to open your eyes to some potential opportunities. But, you cannot just jump into gold or miners after reading this and think you are set for success. The markets are never that simple. You must actively adjust and trade with the market and our daily video analysis is what will keep you on the right side of the market more times than not. This week, we locked in some profits on our long gold ETF, and gold miners ETF, why? because our analysis says both of these are at resistance and could pullback before heading higher. We don’t buy, hope and hold, we enter positions, lock-in profits, rinse, and repeat over and over again.
Get my daily video analysis and trade alerts today by subscribing to the Wealth Building Newsletter.
Chris Vermeulen
www.TheTechnicalTraders.com
Chris Vermeulen has been involved in the markets since 1997 and is the founder of Technical Traders Ltd. He is an internationally recognized technical analyst, trader, and is the author of the book: 7 Steps to Win With Logic
Through years of research, trading and helping individual traders around the world. He learned that many traders have great trading ideas, but they lack one thing, they struggle to execute trades in a systematic way for consistent results. Chris helps educate traders with a three-hour video course that can change your trading results for the better.
His mission is to help his clients boost their trading performance while reducing market exposure and portfolio volatility.
He is a regular speaker on HoweStreet.com, and the FinancialSurvivorNetwork radio shows. Chris was also featured on the cover of AmalgaTrader Magazine, and contributes articles to several leading financial hubs like MarketOracle.co.uk
Disclaimer: Nothing in this report should be construed as a solicitation to buy or sell any securities mentioned. Technical Traders Ltd., its owners and the author of this report are not registered broker-dealers or financial advisors. Before investing in any securities, you should consult with your financial advisor and a registered broker-dealer. Never make an investment based solely on what you read in an online or printed report, including this report, especially if the investment involves a small, thinly-traded company that isn’t well known. Technical Traders Ltd. and the author of this report has been paid by Cardiff Energy Corp. In addition, the author owns shares of Cardiff Energy Corp. and would also benefit from volume and price appreciation of its stock. The information provided here within should not be construed as a financial analysis but rather as an advertisement. The author’s views and opinions regarding the companies featured in reports are his own views and are based on information that he has researched independently and has received, which the author assumes to be reliable. Technical Traders Ltd. and the author of this report do not guarantee the accuracy, completeness, or usefulness of any content of this report, nor its fitness for any particular purpose. Lastly, the author does not guarantee that any of the companies mentioned in the reports will perform as expected, and any comparisons made to other companies may not be valid or come into effect.
Chris Vermeulen Archive |
© 2005-2022 http://www.MarketOracle.co.uk - The Market Oracle is a FREE Daily Financial Markets Analysis & Forecasting online publication.