


Stock Market Outlook: is the S&P today just like 2007 or 2016?
Stock-Markets / Stock Markets 2019 Jun 17, 2019 - 07:44 AM GMTBy: Troy_Bombardia

 Bears are saying “the S&P today looks just like 2007” while bulls are saying “the S&P today looks just like 2016”. In reality, the S&P today is most like 1967 (not quite what you would expect).
Various technical factors suggest that the medium term is bullish.
The short term is mixed, and such a politically-driven market environment certainly does not add to one’s confidence about making short term predictions. Focus on the data and facts. Don’t trade the news.
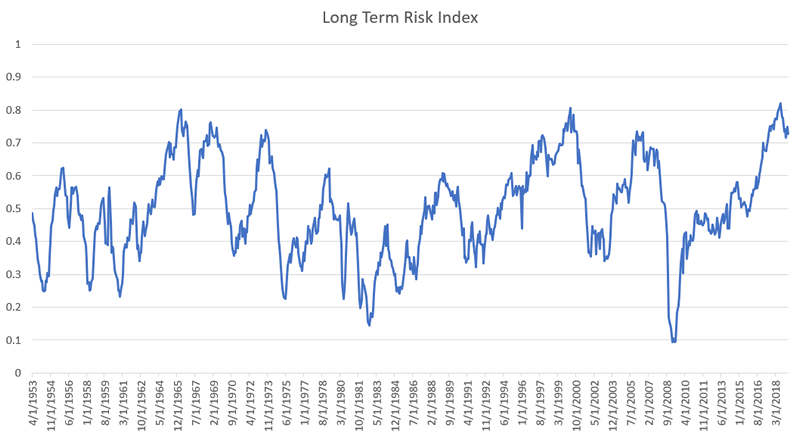
- Fundamentals (long term): no significant U.S. macro deterioration, but the long term risk:reward doesn’t favor bulls.
- Technicals (medium term): mostly bullish
- Technicals (short term): mixed
Let’s begin with technicals because most traders prefer technical analysis over fundamental analysis.
Technicals: Medium Term
*For reference, here’s the random probability of the U.S. stock market going up on any given day, week, or month.

Although the bull market is certainly late-cycle, the stock market’s medium term (next 6-9 months) leans bullish.
Analogue
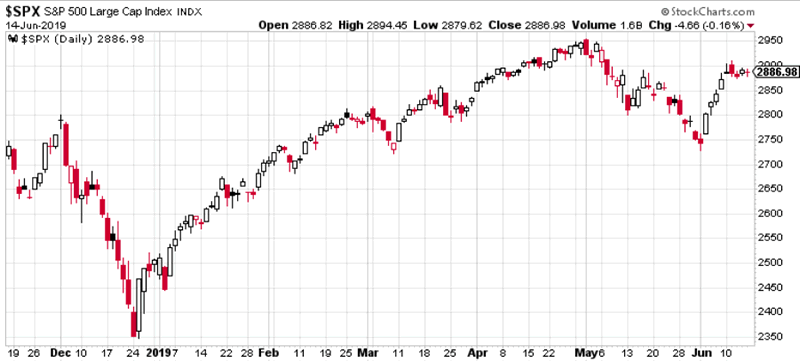
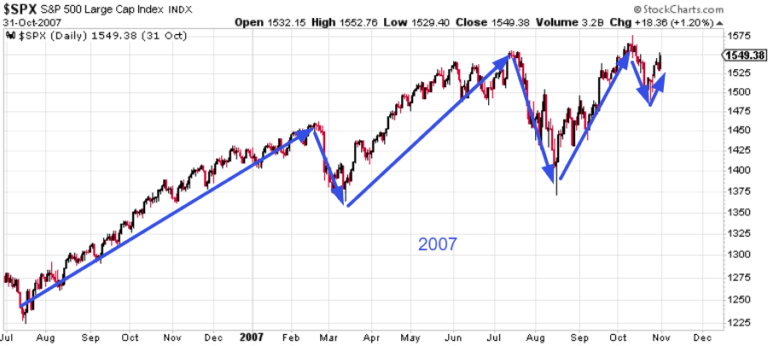
I’ve seen a lot of analysis that goes along the lines of “the S&P today is just like (historical year)”. But if you squeeze, stretch, and change the scales, you can make the S&P today “look just like” any date in the past that fits your bias.
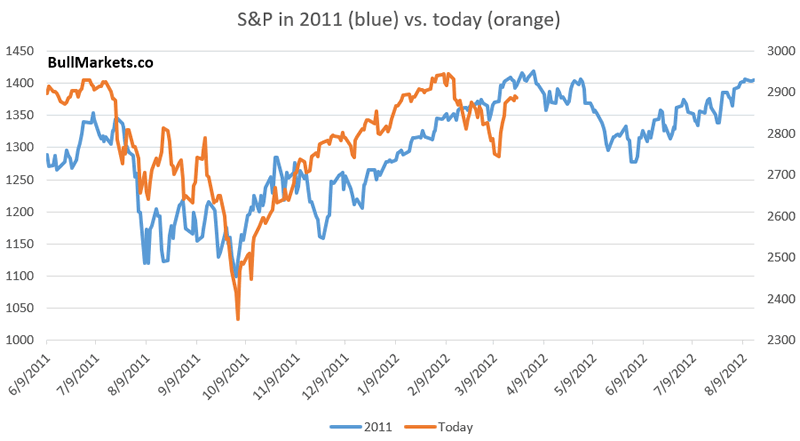
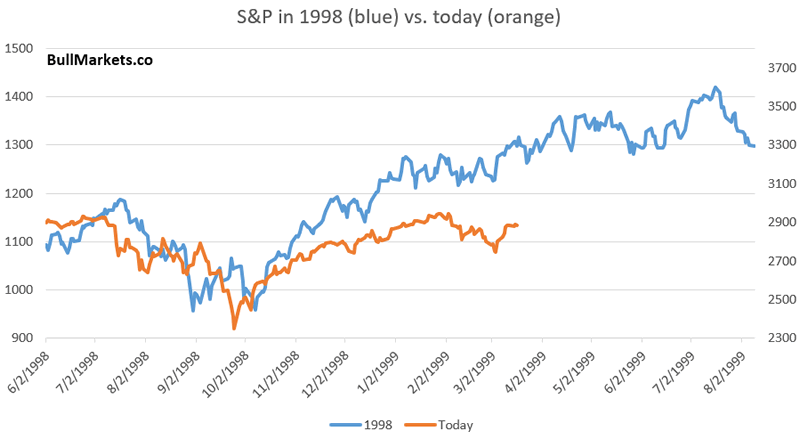
That’s why the S&P “looks just like 2007” (very bearish)…
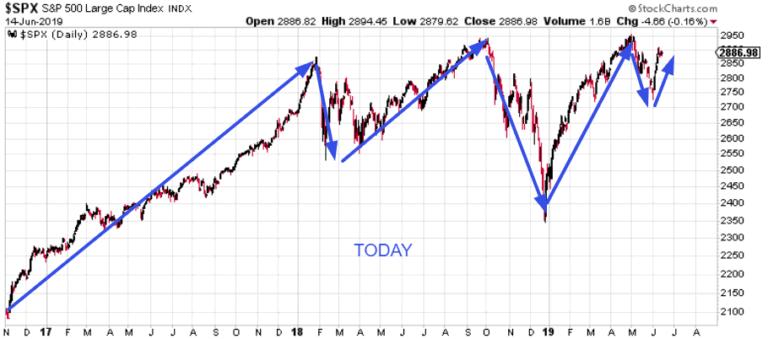
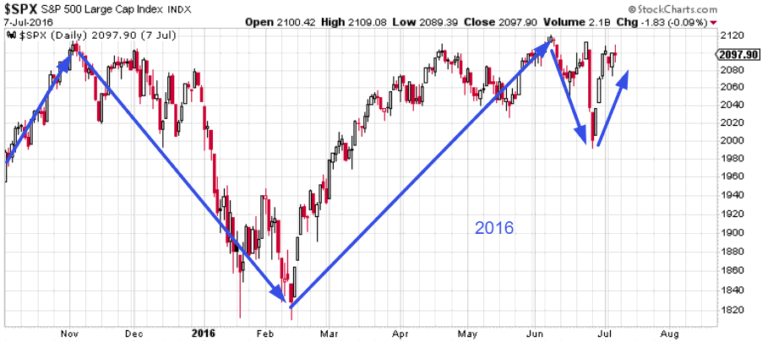
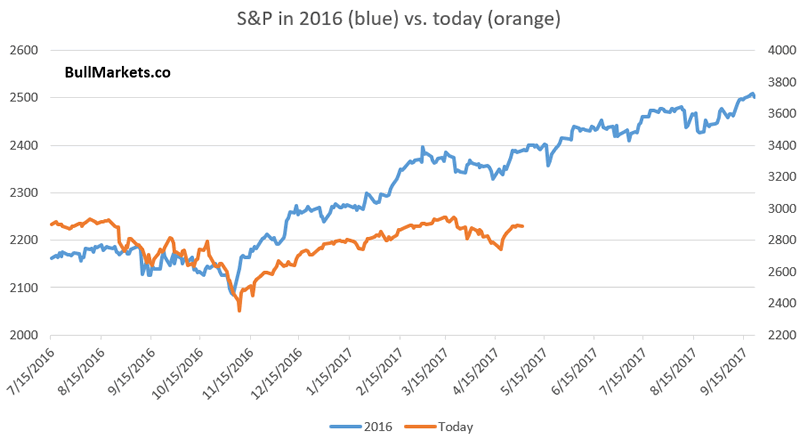
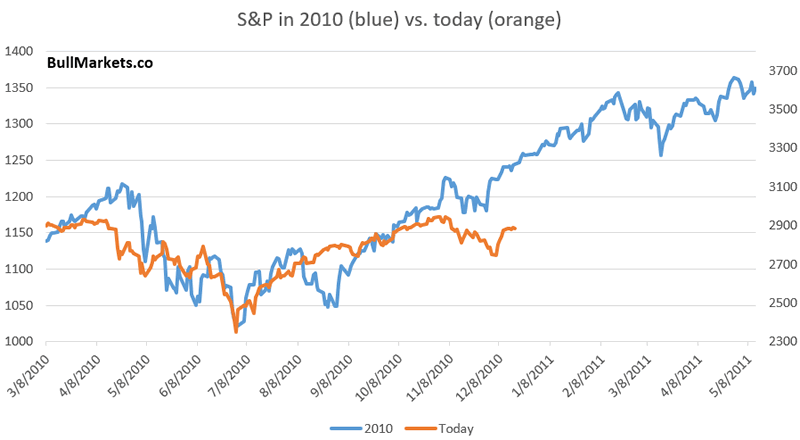
And also “looks just like 2016” at the same time (very bullish)…
To look at analogues properly, I took the S&P’s price over the past 200 days and looked at its correlation to other 200 day periods, from 1950-present. 12 other 200 day historical periods have a correlation greater than 0.7 with the S&P over the past 200 days:
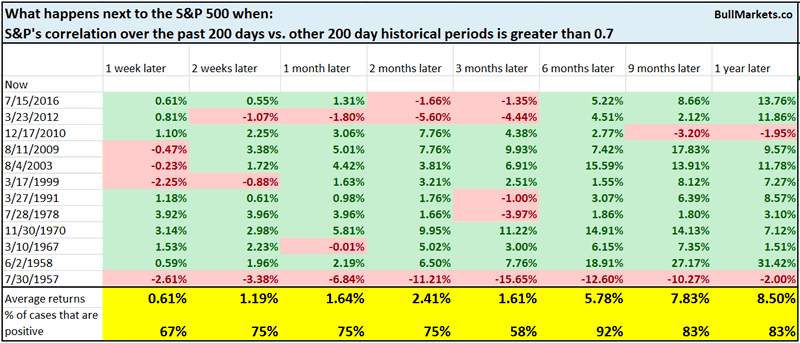
The 6 month forward returns are mostly bullish. Let’s look at some of the more recent examples that did not occur after a recession (since comparing 2009 and 2003 to today makes no sense, given where we are in the economic expansion cycle).
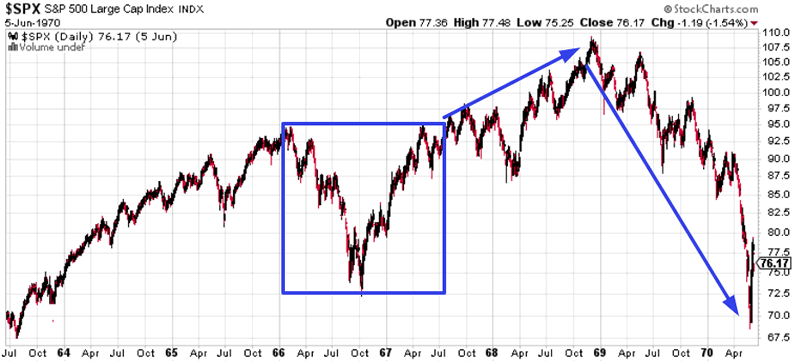
And here’s the most similar period, with a correlation to the present period of more than 0.8
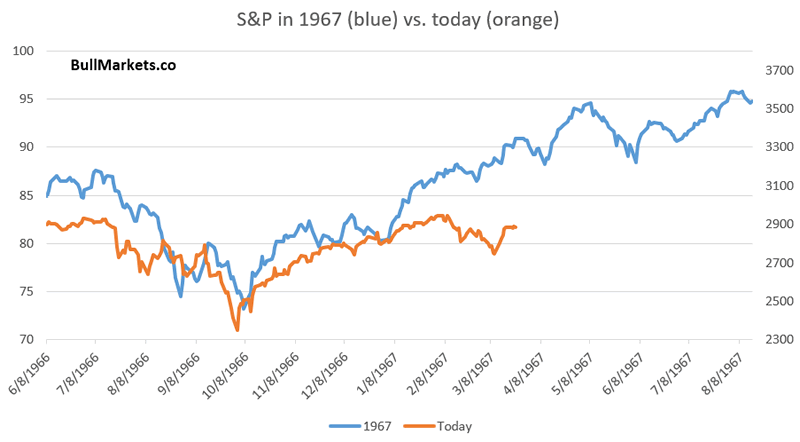
1967 is an interesting historical case, because the bull market lasted another 1.5 years before a big bear market began.
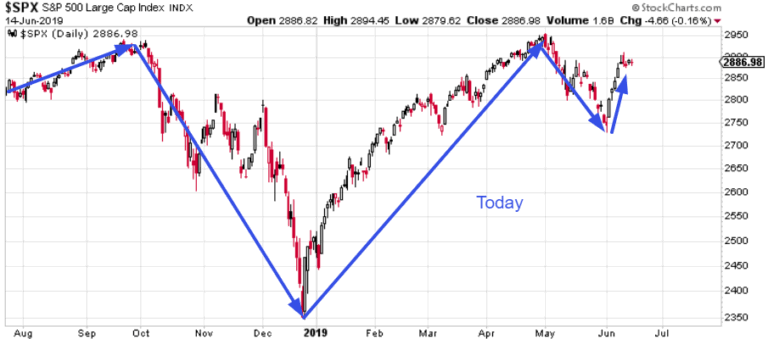
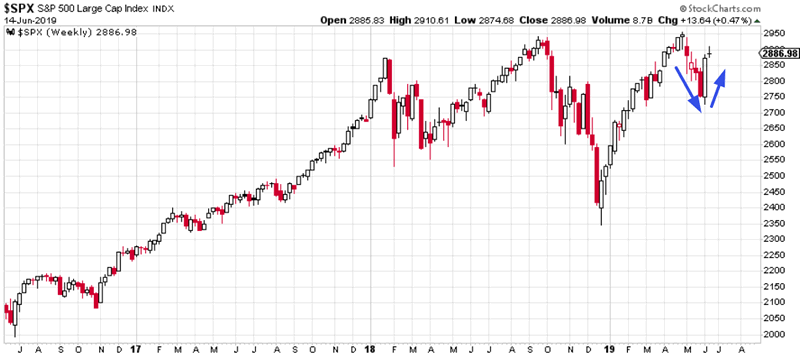
Price action
The S&P fell 4 weeks in a row in May and is now up 2 weeks in a row, while within -3% of a one year high.
Here’s what the S&P did after similar historical cases.
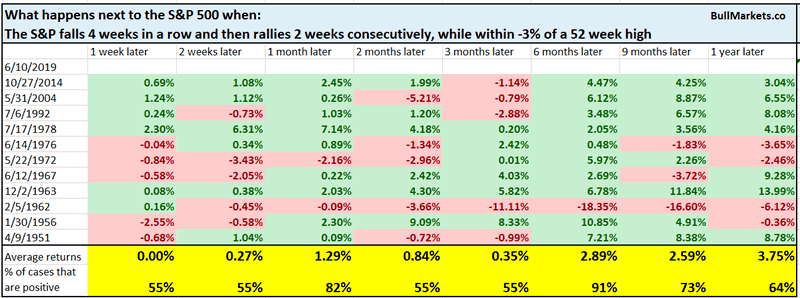
Mostly higher 1 month and 6 months later.
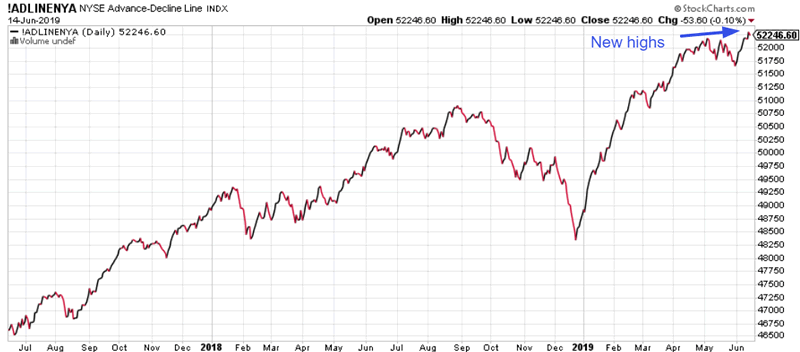
Breadth
The NYSE Advance-Decline line made a new high on Thursday, which is quite fast considering that the S&P was more than -6% below its highs less than 10 days ago. In other words, breadth is very quickly leading the stock market upwards.
Here are similar historical cases in which the Advance-Decline line made a new high so quickly, and what the S&P did next.
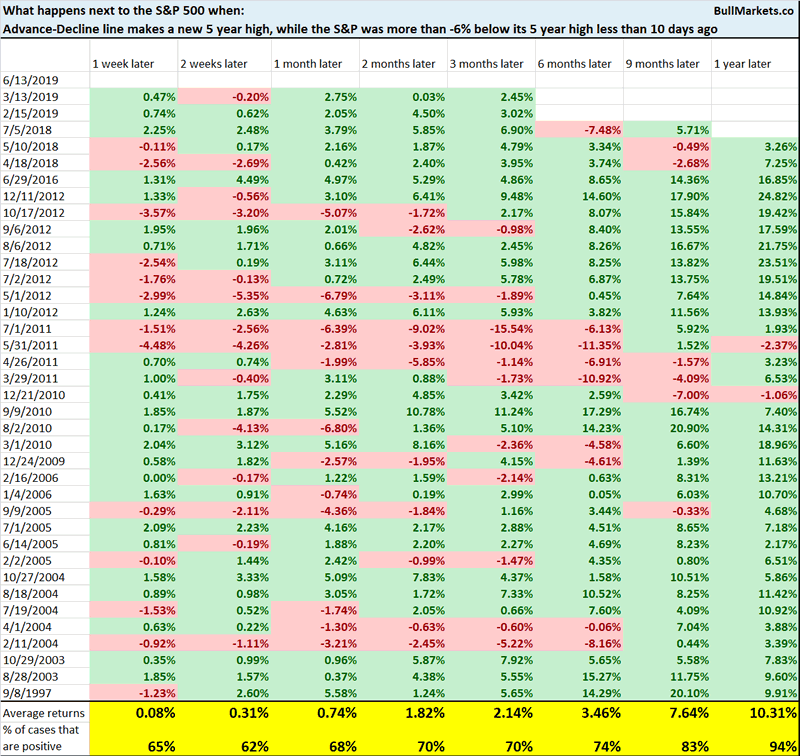
Mostly bullish 9-12 months later.
Smart Money Flow Index
After collapsing in 2018, the Smart Money Flow Index has been trending upwards throughout all of 2019.
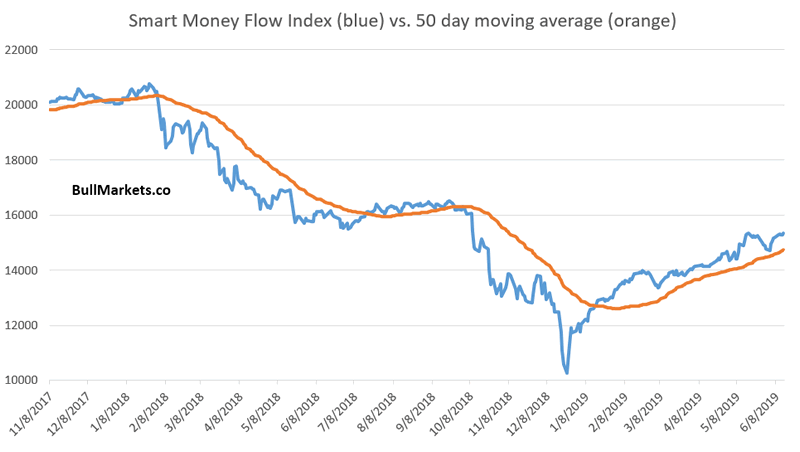
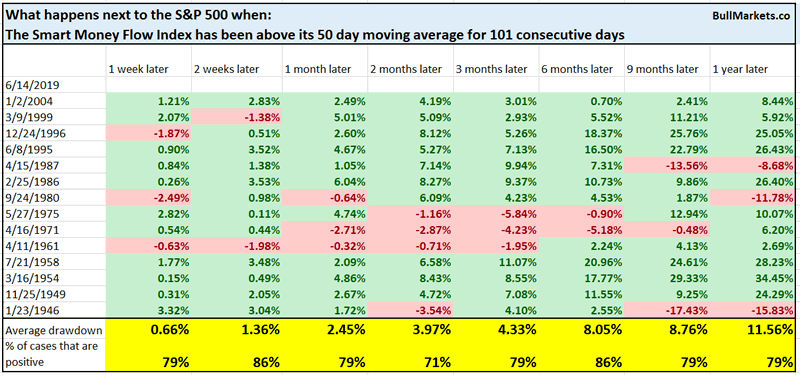
The Smart Money Flow Index has been above its 50 day moving average for 101 consecutive days. This is quite a long time.
Similar long streaks were mostly bullish for the S&P.
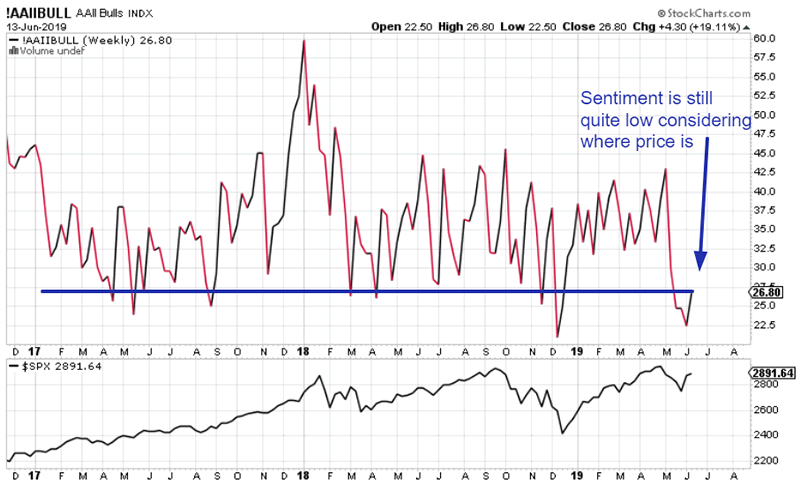
Sentiment
While AAII Bulls % (sentiment) did increase over the past week as the stock market rallied, it is still quite low.
Here’s what happens next to the S&P 500 when the S&P is within -3% of a one year high, while AAII Bulls is below 27%
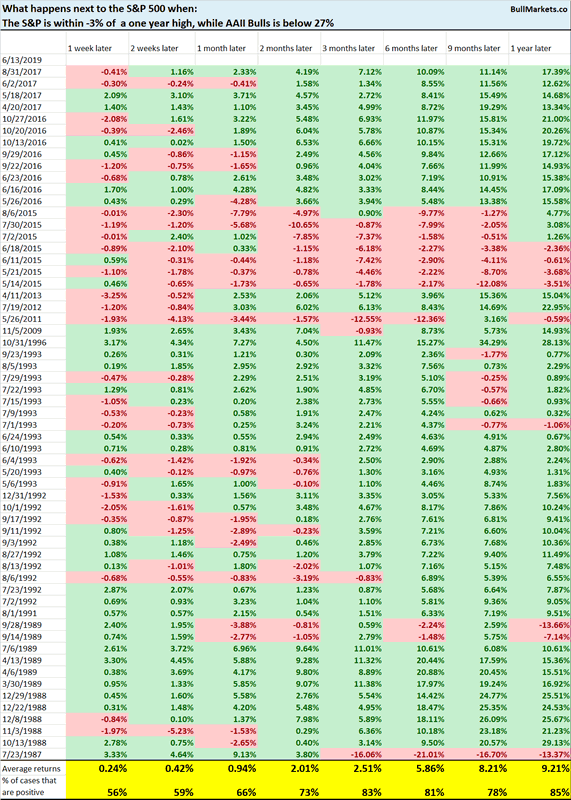
The S&P is mostly bullish 3 months later.
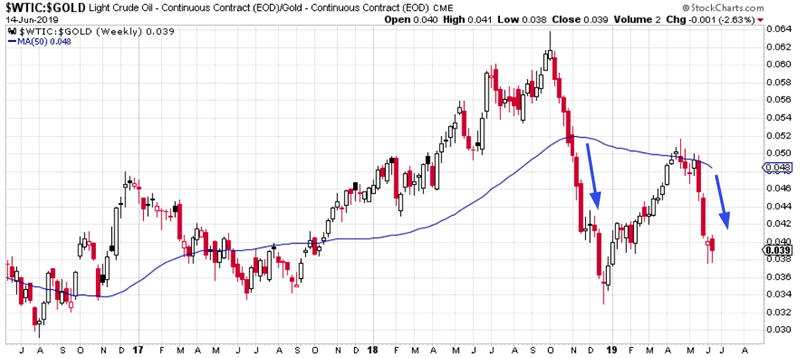
Oil:gold
The media and social media have paid some attention to oil and gold recently, because oil crashed while gold spiked.
The oil:gold ratio is treated by some market watchers as a sign of the economy’s health. The common belief:
If oil crashes and gold spikes (oil:gold ratio falls), the economy is not healthy (demand for energy falls) and investors are shifting towards safe haven assets like gold
Is this belief true? Afterall, the last time this happened was during the November 2018 crash
Here’s what happens next to the S&P when the oil:gold ratio goes from above its 50 week moving average to below its 50 week moving average in less than 3 months
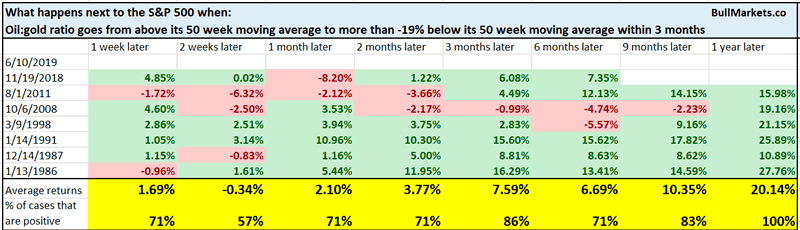
Not consistently bearish on any time frame. I generally don’t like to use market-based indicators to understand what’s going on in the economy. I’d rather use economic indicators to understand what’s going on in the economy.
Recession probabilities
Speaking of economic indicators, FRED has a Smoothed U.S. Recession Probabilities indicator that is quite “high”. In other words, the probability of a recession according to this indicator is increasing.
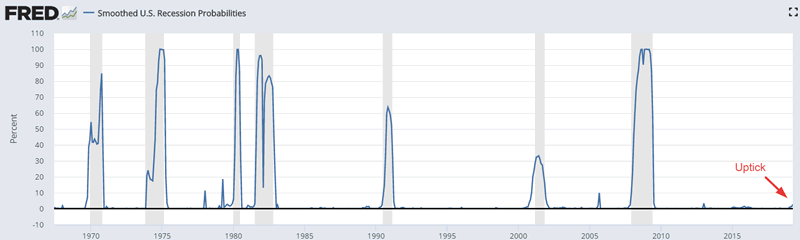
It’s hard to notice the uptick on a linear scale, so here’s a log scale.
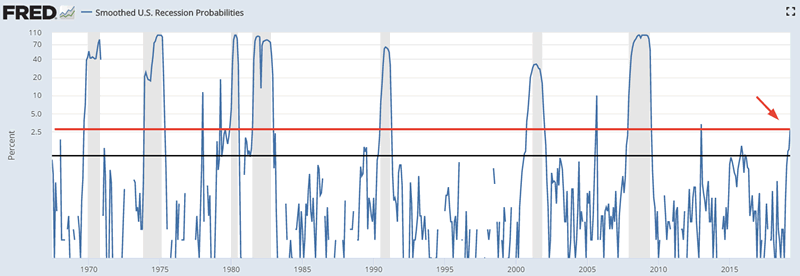
So how bearish is this indicator for the stock market? Here’s what happens next to the S&P when the Smoothed U.S. Recession Probabilities indicator exceeds 2.5%
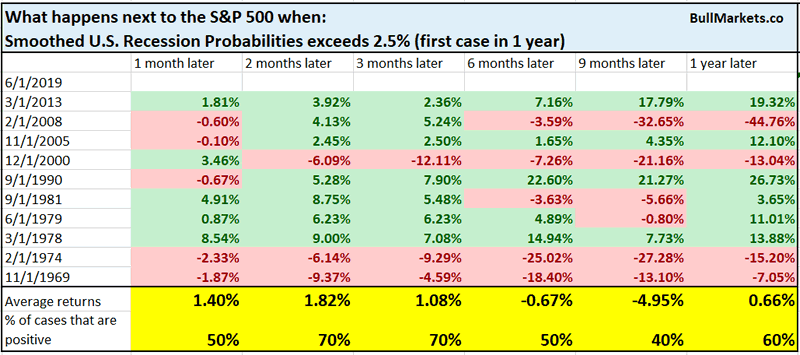
6-12 month forward returns are more bearish than random, but it’s better to wait for a reading above 5%, which gives fewer false bearish signals (2013, 2005, etc).
This recession probability model is more bearish than several others. Why? Just look at its components:
- Non-farm payrolls
- Real personal income excluding transfer payments
- Industrial Production
- Real manufacturing and trade sales
Much of the weakness in the Smoothed U.S. Recession Probabilities indicator comes from the fact that manufacturing and trade are weak (trade war?)
Although this is a warning sign (manufacturing is weak), I wouldn’t worry too much about this. I don’t like to predict the economy based on only 4 indicators.
Lumber
A few months ago a lot of market watchers were stating that “lumber is crashing. This means that the economy and stock market is about to crash too!” Afterall, lumber crashed during or in the leadup to the 2008, 2010, 2011 2015, and 2018 stock market crashes.
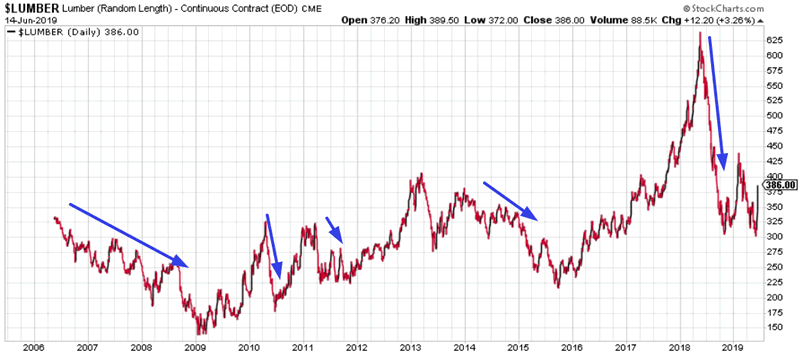
But now that lumber is trying to reverse higher, nobody has mentioned it.
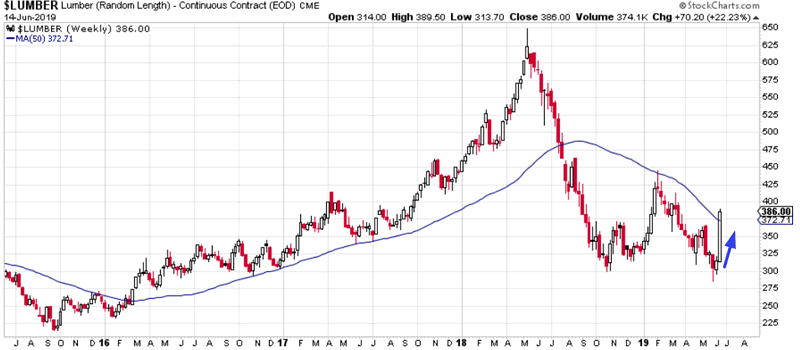
This marks the end of a long streak in which Lumber was under its 50 week moving average
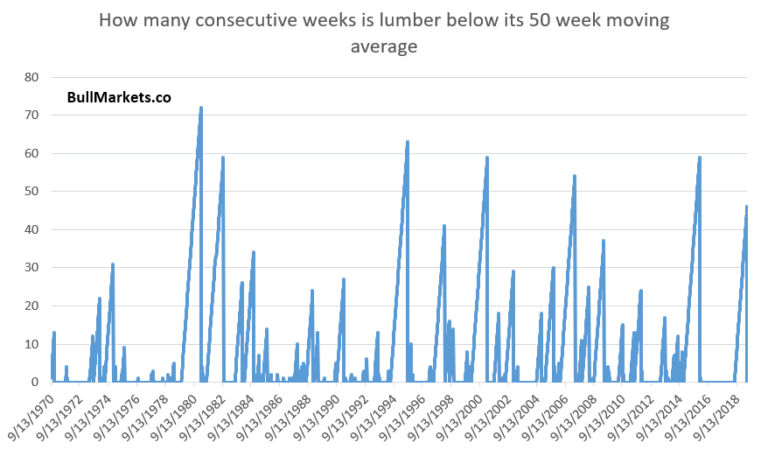
Here’s what happens next to the S&P when lumber rallies above its 50 week moving average for the first time in more than 6 months.
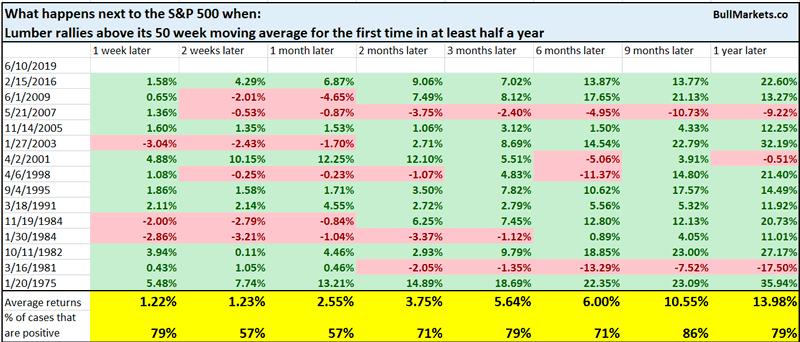
Mostly bullish 9 months later.
Fundamentals: Long Term
The stock market and the economy move in the same direction in the long run, which is why we pay attention to macro.
U.S. leading economic indicators are decent right now, which suggests that a recession is not imminent.
Let’s recap some of the leading macro indicators we covered:
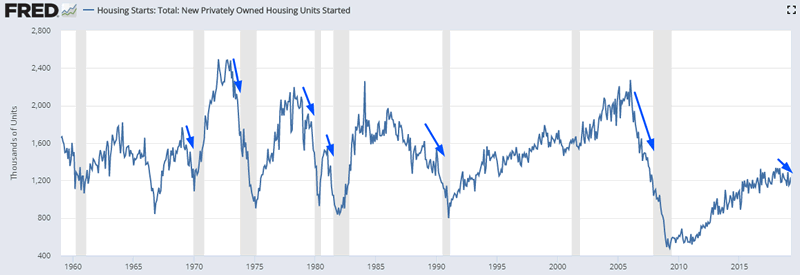
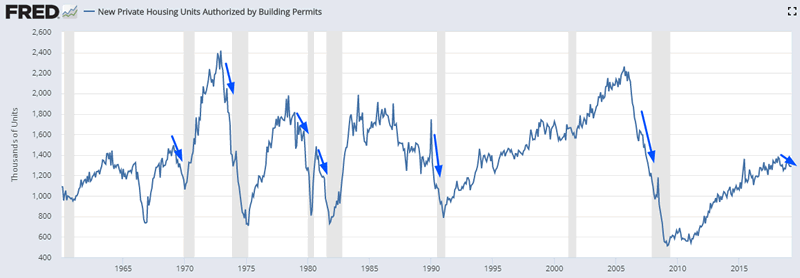
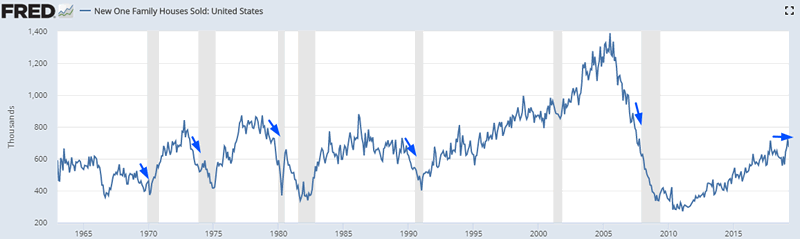
Housing is a slight negative factor, but could improve
Housing – a key leading sector for the economy – remains weak. Housing Starts and Building Permits are trending downwards while New Home Sales is trending sideways. In the past, these 3 indicators trended downwards before recessions and bear markets began.

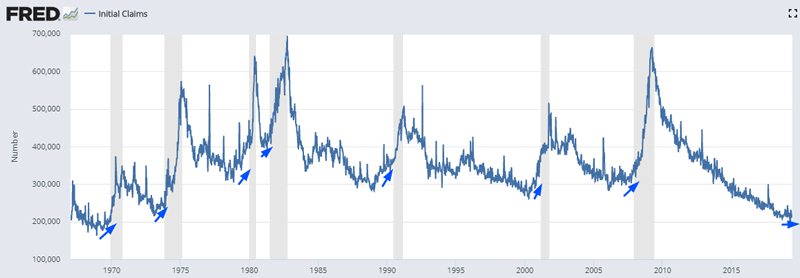
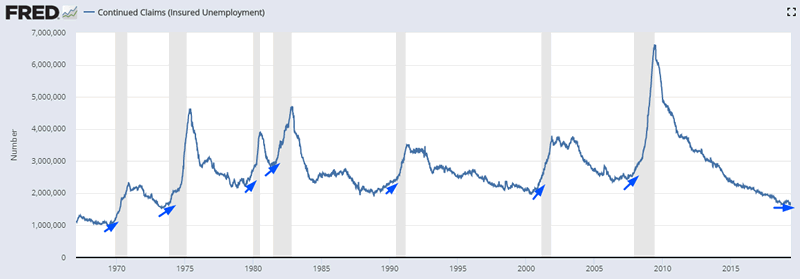
Labor market is still a positive factor
The labor market is still a positive factor for macro. Initial Claims and Continued Claims are trending sideways. In the past, these 2 leading indicators trended higher before bear markets and recessions began.
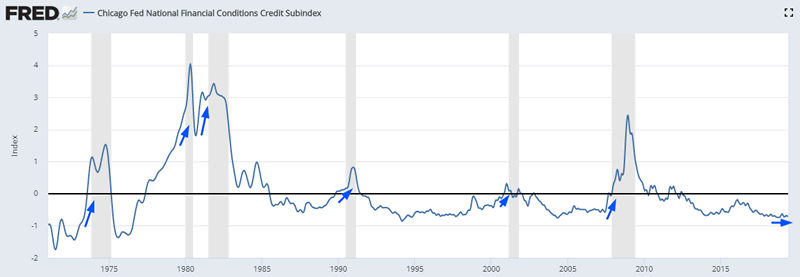
Financial conditions
Financial conditions remain very loose and banks have not significantly tightened their lending standards. In the past, financial conditions tightened before recessions and bear markets began.
Here’s the Chicago Fed’s Financial Conditions Credit Subindex
Heavy Truck Sales
Heavy Truck Sales is still trending upwards. In the past, Heavy Truck Sales trended downwards before recessions and bear markets began.
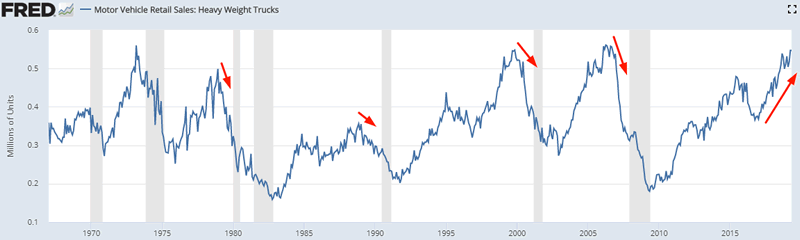
To demonstrate that this is a leading indicator, we can see the S&P 500’s returns after Heavy Truck Sales peaked in each economic expansion.
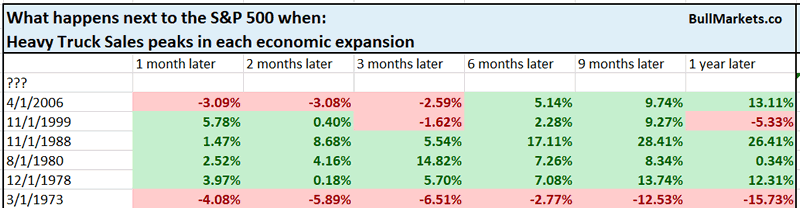
The S&P’s 6-9 month forward returns are mostly bullish after each peak.
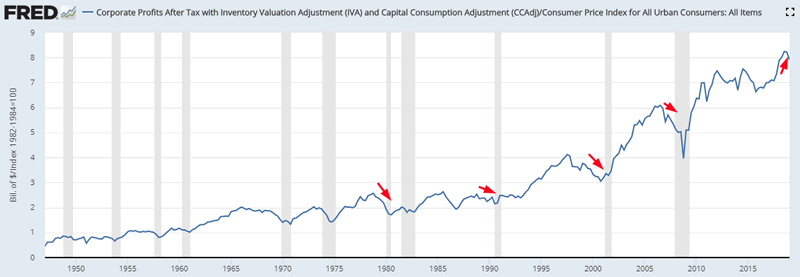
Corporate Profits
The latest reading for inflation-adjusted corporate profits fell. In the past, corporate profits fell before recessions and bear markets began. Since corporate profits leads the S&P by 5-6 quarters, this will be a long term bearish factor for the stock market beginning in Q1 2020 if corporate profits continue to fall.
Lastly, a word on valuations
Valuations are extremely high. Here’s the Shiller P/E ratio
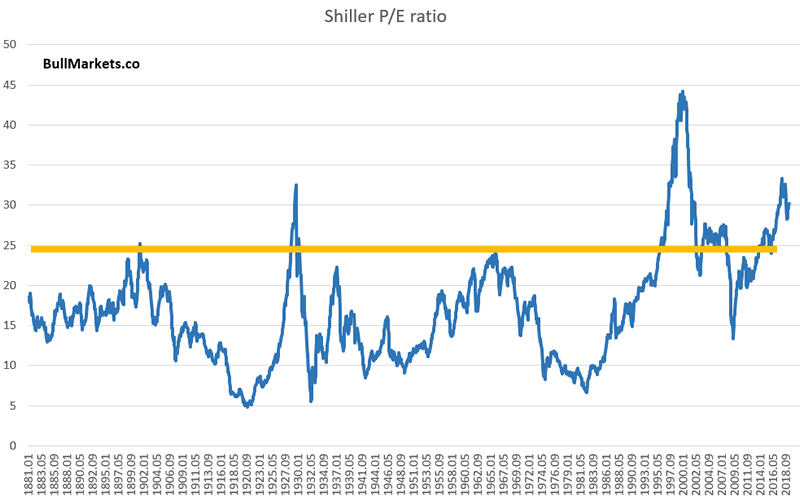
But while valuations give you a sense of how well the stock market will perform over the next 10 years, it tells you very little about what the stock market will do next month, next year, or even the next 2 years.
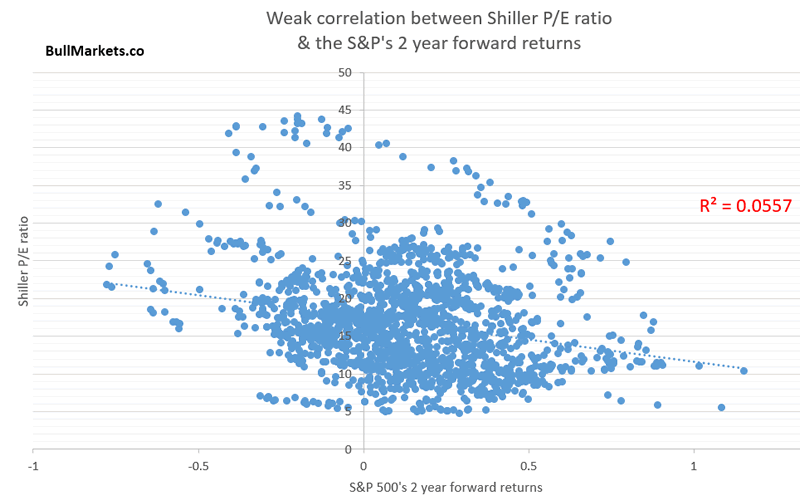
All valuations can tell us right now is that the stock market’s returns over the next 10 years won’t be as good as the past 10 years. This isn’t a unique insight, considering that we are in the tail end of an economic expansion and bull market.
We don’t use our discretionary outlook for trading. We use our quantitative trading models because they are end-to-end systems that tell you how to trade ALL THE TIME, even when our discretionary outlook is mixed. Members can see our model’s latest trades here updated in real-time.
Conclusion
Here is our discretionary market outlook:
- The U.S. stock market’s long term risk:reward is not bullish. In a most optimistic scenario, the bull market probably has 1 year left.
- Most of the medium term market studies (e.g. next 6-9 months) are mostly bullish.
- Market studies for the next 2-3 months lean bullish.
- Market studies over the next 2-4 weeks are mixed.
- We focus on the medium-long term.
Goldman Sachs’ Bull/Bear Indicator demonstrates that risk:reward does favor long term bears.
Click here for more market analysis
Here’s what happens next to the S&P when lumber rallies above its 50 week moving
By Troy Bombardia
I’m Troy Bombardia, the author behind BullMarkets.co. I used to run a hedge fund, but closed it due to a major health scare. I am now enjoying life and simply investing/trading my own account. I focus on long term performance and ignore short term performance.
Copyright 2019 © Troy Bombardia - All Rights Reserved
Disclaimer: The above is a matter of opinion provided for general information purposes only and is not intended as investment advice. Information and analysis above are derived from sources and utilising methods believed to be reliable, but we cannot accept responsibility for any losses you may incur as a result of this analysis. Individuals should consult with their personal financial advisors.
Troy Bombardia Archive |
© 2005-2022 http://www.MarketOracle.co.uk - The Market Oracle is a FREE Daily Financial Markets Analysis & Forecasting online publication.