Has Gold Price Broken Out Or Not? Technicals And Fundamentals
Commodities /
Gold & Silver 2019
Jun 26, 2019 - 11:09 AM GMT
By: Kelsey_Williams

A casual glance at the latest short term chart for GLD would tend to support the notion that, yes, gold has decidedly broken out of its trading range and is headed higher.
Below is a two-year chart of GLD (bigcharts.marketwatch.com) …
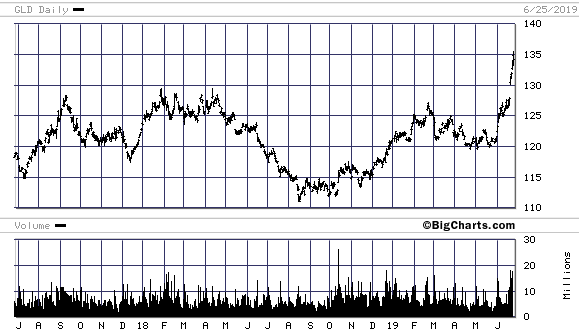
Now that we are all on the same page, let’s step back a moment and ask a couple of questions. What happens next? And, if this is “the big one”, how high might gold go?
Some analysts are pretty quick to point out that this move was expected and is “only the beginning” of much higher prices for gold. They and others also point to expected huge increases in inflation and the signs of a recession as fundamentals that support higher gold prices.
Some think that a collapse in stock prices is imminent and will confirm what they already know. Or worse, that another credit collapse is coming. And, when you throw in political turmoil, social unrest, trade wars, and world wars, well, you get the picture. Everything seems to lend support to the expectation of higher gold prices.
There seem to be a plethora of fundamentals that support higher gold prices. But do they?
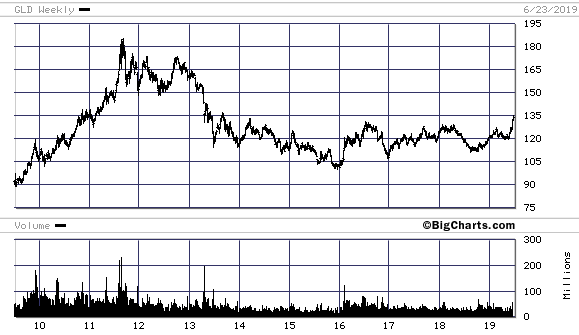
Before we answer that, let’s look at another chart. This one is a ten-year chart of GLD prices…
In looking at this chart, it seems clear that GLD has been contained within a reasonably narrow range, bounded by 105 on the downside and 135 on the upside, over the past six years.
So, let’s ask again, “Has gold broken out or not?”
I don’t think anyone can say yes, decisively. Some further sustained price action on the upside is necessary before a conclusive call can be made.
If you are a super-bull when it comes to gold, you might be wondering why the short-term charts look so bullish. There are two reasons.
The first is that the short-term charts use daily prices for plotting purposes, whereas the long-term charts use weekly prices.
The second reason is that the combination of using weekly prices and plotting the changes on a longer term basis, tends to smooth out some of the more extreme short-term price action.
Looking at the second chart above again, it would take a price for GLD solidly above 135, along with sustained price action above that level, to signal a clear break for gold out of its current six-year trading range. We are not there yet.
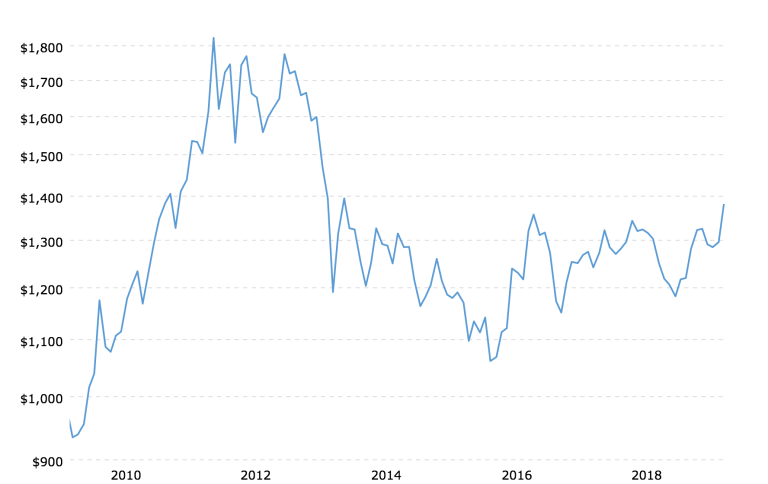
And until we are, talking about new highs in gold prices is premature. This is confirmed when we look at charts of actual gold prices themselves. Below is a ten-year chart (macrotrends.net) of prices for physical gold…
In this chart, the price action for gold over the past six years is also contained in a trading range. The range is between $1100.00 per ounce on the downside and $1400.00 per ounce on the upside.
If the price of gold were to move decisively higher from here, say to $1500.00, or even $1600.00 per ounce, then it would be more reasonable to claim a breakout had occurred. Then there will be more to talk about.
Now lets talk about fundamentals for gold.
Here is where the arguments for higher gold prices seem to break down. That is because what everyone refers to as fundamentals for gold are not fundamentals at all. They are events or situations that have nothing to do with gold prices. And some of them are contradictory.
For example, a recession is a period marked by a decline in economic activity. A decline in economic activity can worsen and develop into a full-scale depression.
During a depression, the prices of goods and services would decline, as well as investment prices for stocks, commodities and real estate. These are conditions that are symptomatic of deflation. Deflation is an increase in the value of a currency.
Deflation is just the opposite of inflation, and not a condition that would bring about higher gold prices.
As contrasted with deflation, there are expectations for the effects of inflation to be much worse ahead, and sooner. And that is certainly possible. But, it is not a foregone conclusion.
Some are saying that because the Fed has changed their stance on interest rates, and are now, apparently, pursuing a more accommodative easing of money and credit, that gold has been given a green light on the road to much higher prices. That is not necessarily so.
If the overwhelming inflationary impact of the Fed’s efforts a decade ago were barely able to keep us from falling into a bottomless pit of depression and deflation, how is it that anyone thinks that things would be that much different this time around?
As bad as trade war can be for the economy, trade wars usually result in declines in economic activity and can be triggers for recessions and depressions. As we said, these conditions highlight the forces of deflation, not inflation.
There is only one thing that affects the price of gold. That one thing is the US dollar.
Nothing else matters.
Gold’s price is a reflection of what is happening to the US dollar. Any conditions you can possibly imagine that could take gold prices higher, no matter how severe, will not have any lasting impact on gold prices. It is all about the US Dollar. (see What’s Next For Gold? – It’s All About The US Dollar)
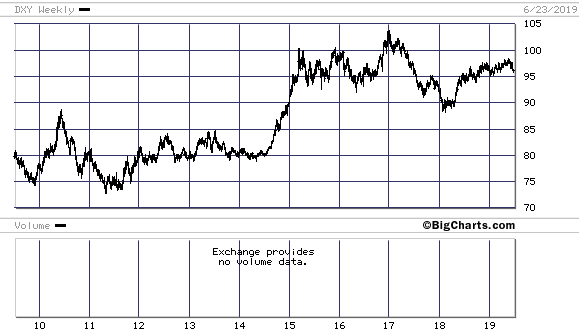
Below is a ten-year chart of DXY, the US Dollar Index. It is not my preferred choice for analysis for many reasons (see Gold – US Dollar vs US Dollar Index) but, since most are familiar with it, we’ll use it…
As you can see, the US Dollar Index has been contained in a trading range of its own for the past five years. The range, between 90 on the downside and 100 on the upside, is consistent with price action of gold for the past several years.
And, similar to gold, the US dollar has not broken out of its trading range, even though short-term charts may indicate otherwise. In the US dollar’s case, any breakout must be to the downside in order to confirm any breakout to the upside for gold.
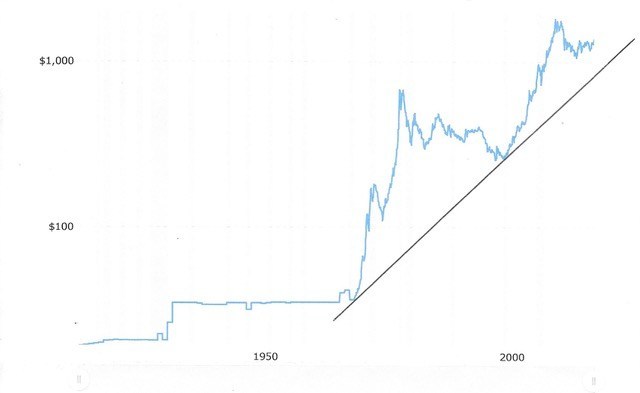
Looking at all of this, it seems quite possible that breaks to the downside for gold and upside for the US dollar are just as likely. This would be directly the opposite of what many are expecting but here are a couple of long-term charts that show how much downside potential exists for gold prices.
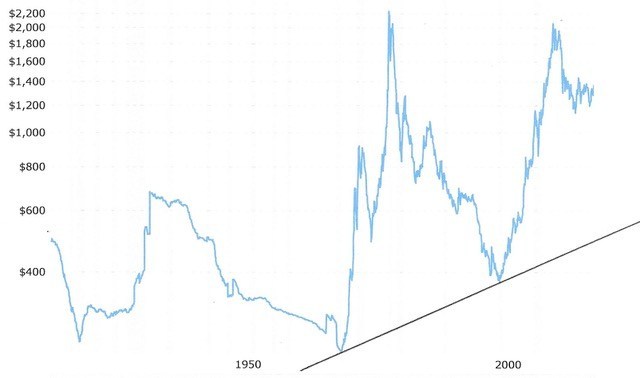
Both charts are of the same one-hundred year history of gold prices. The difference is that the second chart is inflation-adjusted.
Both charts show a fifty-year uptrend in the gold price dating back to 1970. Looking at the first chart, gold’s price could move basically sideways over the next several years, and even fall as low as $1000.00 per ounce, without violating the significantly steep uptrend that is in place.
Looking at the second chart, we can see that there is a lot more room on the downside for gold prices. In today’s dollars gold could possibly fall as low as $575.00 per ounce. Before you discount that possibility entirely, please remember that we are at a juncture in time and space that bears some similarity to that which occurred several years after the 1980 peak in prices.
After its peak price of $850.00 per ounce in January 1980, gold’s price fell over the next five years to near $300.00 per ounce by January 1985. Three years later it was almost sixty percent higher at $500.00 per ounce.
After that gold went sideways for nearly ten years and eventually fell back to sub-$300.00 per ounce prices. Something similar today could take gold back to $600-$800.00 per ounce.
Even if gold prices currently are headed for $1500-1600.00 per ounce, it doesn’t mean that everything has changed. We are still in a long-term decline in gold prices and there is possibly more to come.
The only thing that will change that is if the US dollar renews its long-term descent into oblivion. Right now, that is not happening.
Kelsey Williams is the author of two books: INFLATION, WHAT IT IS, WHAT IT ISN’T, AND WHO’S RESPONSIBLE FOR IT and ALL HAIL THE FED!
By Kelsey Williams
http://www.kelseywilliamsgold.com
Kelsey Williams is a retired financial professional living in Southern Utah. His website, Kelsey’s Gold Facts, contains self-authored articles written for the purpose of educating others about Gold within an historical context.
© 2019 Copyright Kelsey Williams - All Rights Reserved Disclaimer: The above is a matter of opinion provided for general information purposes only and is not intended as investment advice. Information and analysis above are derived from sources and utilising methods believed to be reliable, but we cannot accept responsibility for any losses you may incur as a result of this analysis. Individuals should consult with their personal financial advisors.
© 2005-2022 http://www.MarketOracle.co.uk - The Market Oracle is a FREE Daily Financial Markets Analysis & Forecasting online publication.