


Zig-Zagging Gold Is Not Necessarily Bearish Gold
Commodities / Gold & Silver 2019 Nov 20, 2019 - 04:20 PM GMTBy: P_Radomski_CFA

 In Friday’s article, we wrote that what comes up must correct and gold has indeed shown to be in a corrective mode. We also wrote that the yellow metal was unlikely to break below the 61.8% Fibonacci retracement based on the previous upswing and while gold moved to this level earlier today, it didn’t break below it. At least not in any significant way – the few cents below this level doesn’t really count. Let’s take a closer look at gold’s overnight chart to see what the decline means.
In short, it doesn’t mean much. All markets, including gold, quite often correct in a zigzag fashion, and they relatively often correct between 38.2% and 61.8% of the preceding move before continuing their previous move. That’s exactly what is happenning in gold.
Gold moved to the 61.8% Fibonacci retracement level based on the preceding upswing and it moved there in a zig-zag style. Gold reversed after reaching the retracement, so the bottom might be in and the yellow metal could be ready to resume its upswing shortly. If gold confirms the breakdown below the 61.8% Fibonacci retracement level ($1457), the bullish forecast for gold for the short-term might change, but that’s not the case so far.
Besides, the short-term correction in the USD Index that’s likely to contribute to higher gold, silver, and mining stock values in the short run is not over just yet.
Is the USD Index Done Declining?
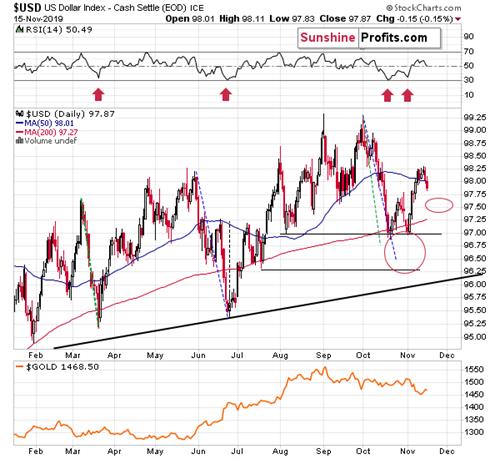
The breakdown below the very short-term rising wedge pattern resulted in a major decline. “Major” from the very short-term point of view as the following daily downswing has been the biggest daily decline that we saw this month. After the initial decline, the move lower continued and the USDX closed the week below its 50-day moving average. The 50-day MA has been providing support quite reliably in the previous months. It was not always strong support, but often meaningful enough to make it useful as a trading tool. While it stopped the decline on Thursday, the USDX broke below it overall.
The above breakdown opened the way to even lower USDX values.
The green and blue dashed lines represent declines that are similar to the October decline. The rallies that followed them were quite sharp, but they too had smaller pauses within them. Both: March-April, and July rallies consolidated after the USDX moved above its 50-day moving average.
The short-term decline that we saw so far doesn’t compare to what we saw in early April and in mid-June. Consequently, the odds are that the USD Index will decline some more before soaring to new highs.
This means that gold is likely to move higher before plunging. Consequently, the odds are that reports of gold turning bearish for the short run are premature.
Also, let’s keep in mind that this decline is taking place after both gold and silver invalidated their previous breakdowns in terms of daily closing prices.
Precious Metals Short-Term
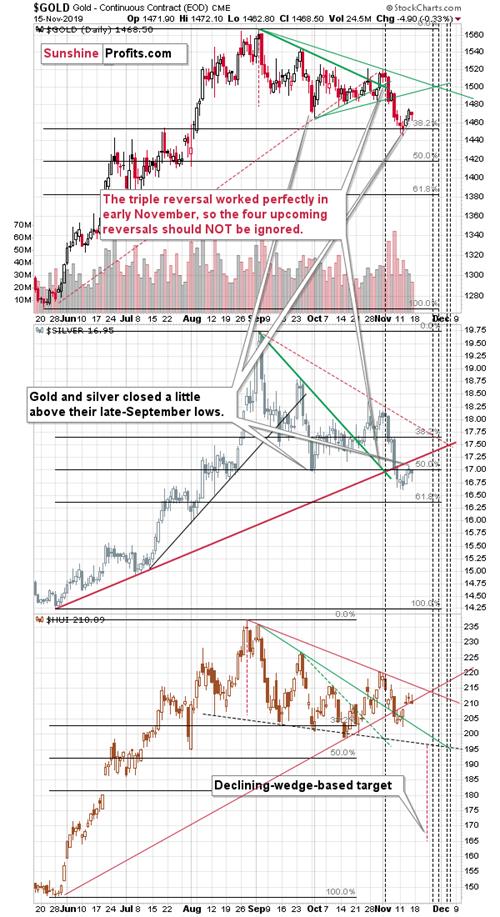
On Thursday, both precious metals closed slightly (but still) above their lowest closing prices of September. Silver didn’t move back above the rising red support/resistance line, but the breakdown below the previous low was invalidated.
The resistance provided by the lows is a good reason why gold and silver corrected on Friday and earlier today. But, just as the decline in the USDX doesn’t seem to be over, the rally in gold and silver seems to have more upside.
And the mining stocks?
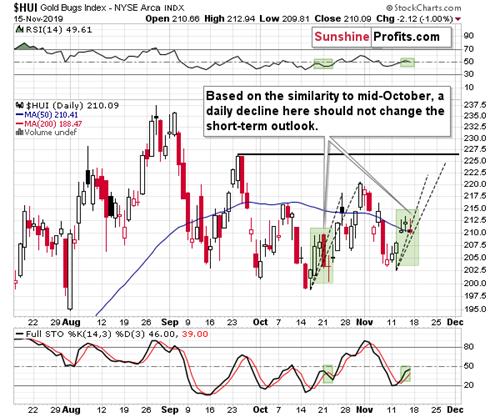
Looking at miners’ performance in one way provides us with bearish implications for the day, but looking from a different angle shows the silver lining.
The bearish case is based on the shape of the last three sessions. They look like an island top that formed right after the bullish reversal. Gold is down in today’s pre-market session, so gold stocks are likely to decline today as well, in tune with implications of the above-mentioned top formation.
On the other hand, such a daily comeback close to the start of the rally is exactly what happened about a month ago, and it was a relatively normal part of the upswing. The similarity may not be obvious at first sight, but please note the three intraday attempts to reach more than about half of the preceding downswing. In the following days, the HUI Index continued to rally, but not without a daily decline first.
The positions of Stochastic and RSI indicators confirm the similarity between these two cases.
All in all, even though gold moved lower today, it doesn’t mean that the short-term rally is already over.
The short term is one thing and the big move that’s likely to unfold is something quite different. The gold futures open interest (number of positions in gold futures) just exceeded its previous extremes and if it sounds as something of key importance to you – you’re perfectly right. There are two ways in which this major development is practically screaming what’s going to happen next. But one needs to know how to read this sign. Today’s Gold Trading Alert – the full version of this analysis – covers all the details to know before (!) the big gold price move happens. Please note that you can still subscribe to these Alerts at very promotional terms – it takes just $9 to read the details right away and then receive follow-ups for the next three weeks. Stay informed at very preferred terms.
The above article is a small sample of what our subscribers enjoy on a daily basis. Check more of our free articles on our website, including this one – just drop by and have a look. We encourage you to sign up for our daily newsletter, too - it's free and if you don't like it, you can unsubscribe with just 2 clicks. You'll also get 7 days of free access to our premium daily Gold & Silver Trading Alerts to get a taste of all our care. Sign up for the free newsletter today!
Thank you.
Przemyslaw Radomski, CFA
Editor-in-chief, Gold & Silver Fund Manager
Sunshine Profits - Effective Investments through Diligence and Care
* * * * *
All essays, research and information found above represent analyses and opinions of Przemyslaw Radomski, CFA and Sunshine Profits' associates only. As such, it may prove wrong and be a subject to change without notice. Opinions and analyses were based on data available to authors of respective essays at the time of writing. Although the information provided above is based on careful research and sources that are believed to be accurate, Przemyslaw Radomski, CFA and his associates do not guarantee the accuracy or thoroughness of the data or information reported. The opinions published above are neither an offer nor a recommendation to purchase or sell any securities. Mr. Radomski is not a Registered Securities Advisor. By reading Przemyslaw Radomski's, CFA reports you fully agree that he will not be held responsible or liable for any decisions you make regarding any information provided in these reports. Investing, trading and speculation in any financial markets may involve high risk of loss. Przemyslaw Radomski, CFA, Sunshine Profits' employees and affiliates as well as members of their families may have a short or long position in any securities, including those mentioned in any of the reports or essays, and may make additional purchases and/or sales of those securities without notice.
Przemyslaw Radomski Archive |
© 2005-2022 http://www.MarketOracle.co.uk - The Market Oracle is a FREE Daily Financial Markets Analysis & Forecasting online publication.