


Stock Market Final Thrust
Stock-Markets / Stock Markets 2020 Jan 14, 2020 - 07:30 AM GMTBy: Andre_Gratian

Current Position of the Market
SPX: Long-term trend – There are no signs that the bull market is over.
Intermediate trend – Most likely near an intermediate top.
Analysis of the short-term trend is done on a daily basis with the help of hourly charts. It is an important adjunct to the analysis of daily and weekly charts which discusses the course of longer market trends.
Daily market analysis of the short-term trend is reserved for subscribers. If you would like to sign up for a FREE 4-week trial period of daily comments, please go to www.marketurningpoints.com and request a trial.
Market Review
Point & Figure Overview of SPX
Long-term trend: The bull market which started in 03/09 shows no sign of having run its course. A rough count taken on the long-term Point & Figure chart gives us a potential target to as high as 4080. P&F does not predict time, only price. (no change)
Intermediate trend: After forming a congestion pattern at 3240, SPX has pushed a little higher. The pattern suggests 3280 (which has already been reached) to 3300. This is in accord with the long-term chart (3X10) which projects these levels as the next target if 3240 does not contain the advance. This was mentioned as a possibility in a former Newsletter.
Market Analysis (All charts are courtesy of QChart)
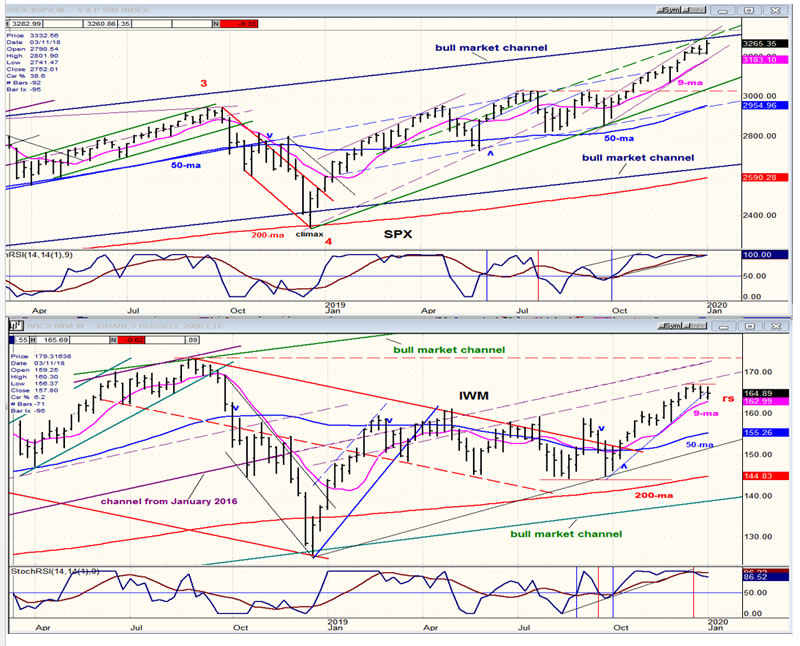
SPX-IWM weekly charts
Another week, another new high – for SPX! Not so for IWM which has refused to follow for the second consecutive week, thereby enhancing its relative weakness. Past experience has taught us what that means: a top is close!
As mentioned in the P&F section, SPX has a good possibility of reaching 3300 before this steady uptrend comes to an end. My target date is around January 15, which is next week!
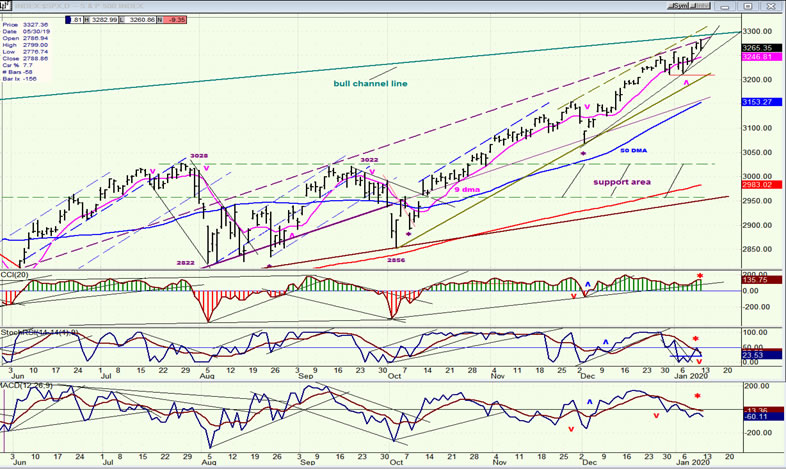
SPX daily chart
The new high in SPX was short-lived, as it met with resistance at the dashed trend line which has contained prices for the past two weeks. If it tries to move higher, the index will encounter even more serious resistance at the top of the bull market channel line; but it is apparently going to try for it since 3300 is likely to be the next P&F target.
After nine years of bullishness followed by a sharp correction, SPX was able to maintain another sustained uptrend to the top of its long-term channel. This is remarkable in itself, but won’t be the end of it. After a correction, the index should go for even higher targets over the next several months, perhaps eventually reaching about 4000 – another 700 points! But not before we imminently experience a correction which will pull it away from the top of the long-term channel and create some room for the next uptrend.
This is suggested by cycles bottoming over the next few weeks, but it is also very apparent in the oscillators at the bottom of the chart, with the two lower ones (SRSI and A-Ds) already in the red and down-trending, and the laggard CCI just beginning to roll over after experiencing more negative divergence.
The final sequence should be as follows: first we should break the minor up-trend line, have a final rally (to 3300?), and then break the trend line from 3070. This should result in a decline that will continue into the three mid-February cycle lows.
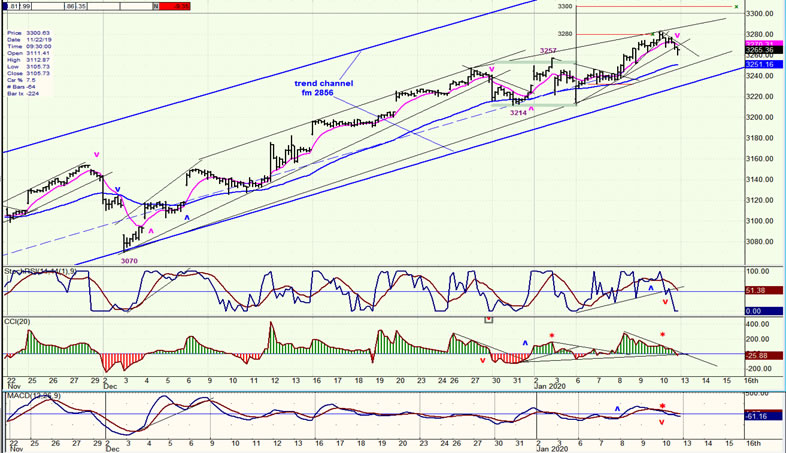
SPX hourly chart
The 3240 projection which was determined by the long-term P&F chart only stopped the uptrend from 2856 for a two-week consolidation which was followed by a price extension to 3281.82 before another minor correction took hold on Friday.
The congestion pattern established during that two-week pause gave us a new projection target to 3280-3300. 3280 was reached on Friday and gave way to a 22-point pull-back. If Friday’s low is exceeded, correction targets consist of 3256 (.382), and perhaps farther down to 3248 (.50), before we embark on the last thrust to 3305.
Because Friday’s close brought the oscillators to the verge of a sell signal, Monday morning will have to open higher and show some sustained buying to avoid one. But since Friday’s retracement had not even reached 3256, it’s likely that our corrective move is not yet complete. When it is, either a retest of 3280 or a final high of 3305 is likely.
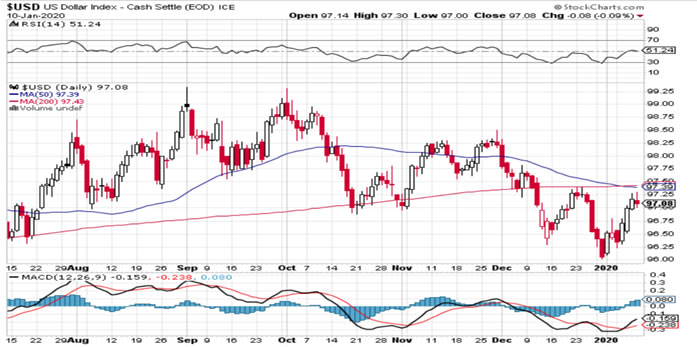
$USD daily (courtesy StockCharts)
The dollar has rebounded from nearly 96 to a little above 97. After a little pull-back, it may continue to move up into the resistance created by the junction of the 50-dma and the 200-dma. This resistance area could put any further progress on hold for some time; at least until mid-February.
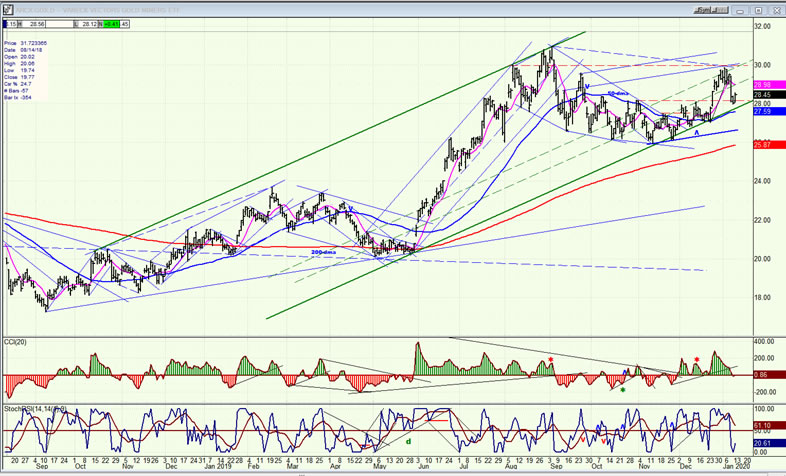
GDX (Gold miners ETF) weekly
After finding resistance just below the former high of 30.96, SPX is consolidating ahead of its next move to a new high which could take it to about 34.50 before another short-term correction. The length of the current consolidation is expected to be about two weeks.
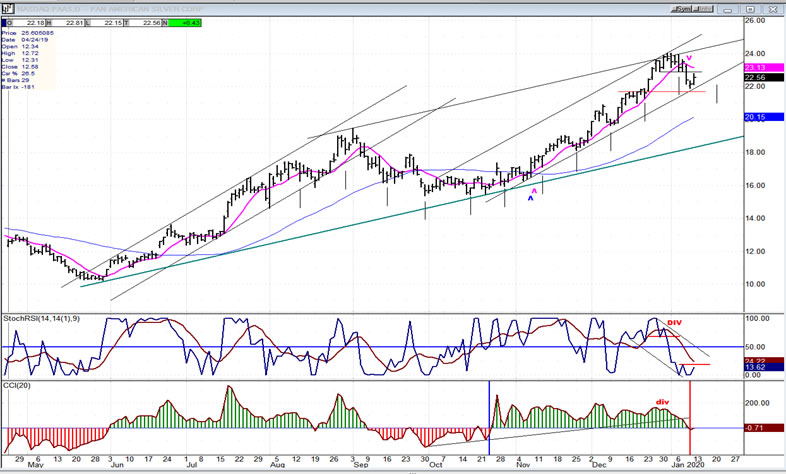
PASS (Pan American Silver Corp.) Weekly
PAAS is moving pretty much in tandem with GDX. Both are undergoing a short-term correction after which PAAS should rise to a new high estimated to be at least 29.00.
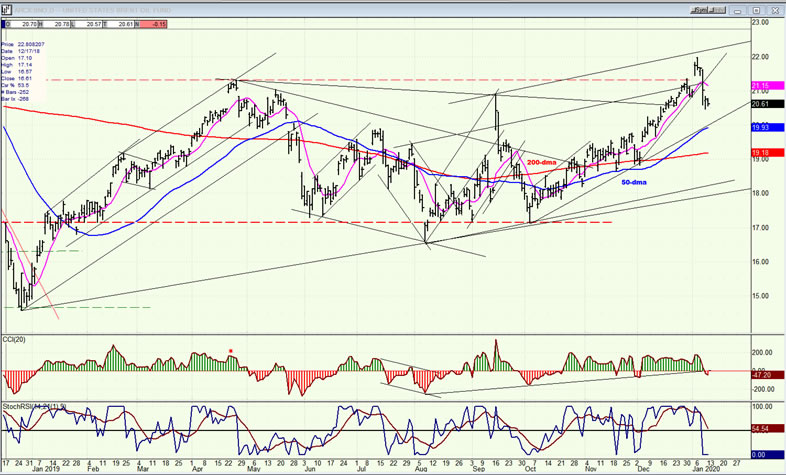
BNO (U.S. Brent oil fund) daily
BNO reached its short-term projection to 22.00 and is pulling-back. Not sure how long this correction is going to last. Index action will tell us.
Summary
A final thrust to about 3300 is possible when the trade deal is signed next Wednesday. I would expect this to be the final hurrah of the SPX before cycles take over and bring about a decline into mid-February. IWM is already giving us advance warning.
Andre
FREE TRIAL SUBSCRIPTON
For a FREE 4-week trial, send an email to anvi1962@cableone.net, or go to www.marketurningpoints.com and click on "subscribe". There, you will also find subscription options, payment plans, weekly newsletters, and general information. By clicking on "Free Newsletter" you can get a preview of the latest newsletter which is normally posted on Sunday afternoon (unless it happens to be a 3-day weekend, in which case it could be posted on Monday).
Disclaimer - The above comments about the financial markets are based purely on what I consider to be sound technical analysis principles uncompromised by fundamental considerations. They represent my own opinion and are not meant to be construed as trading or investment advice, but are offered as an analytical point of view which might be of interest to those who follow stock market cycles and technical analysis.
Andre Gratian Archive |
© 2005-2022 http://www.MarketOracle.co.uk - The Market Oracle is a FREE Daily Financial Markets Analysis & Forecasting online publication.