


Are FANG Technology Stocks Setting Up For A Market Crash?
Companies / Tech Stocks Feb 24, 2020 - 01:47 PM GMTBy: Chris_Vermeulen

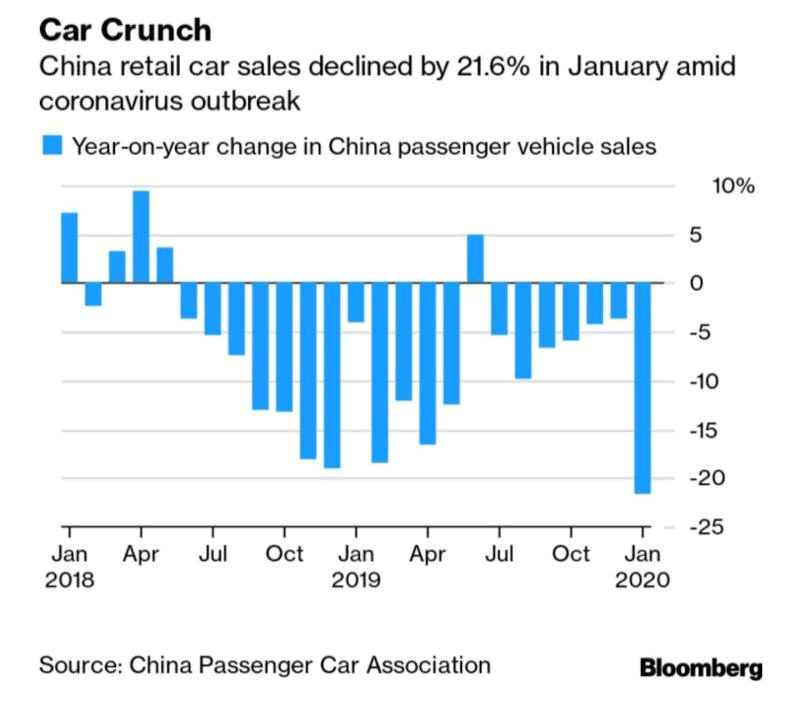
As we continue to get more and more information related to the Coronavirus spreading across Asia and Europe, the one thing we really must consider is the longer-term possibility that major global economies may contract in some manner as the Chinese economy is currently doing. The news suggests over 700+ million people in China are quarantined. This is a staggering number of people – nearly double the total population of the entire United States.
If the numbers presented by the Chinese are accurate, the Coronavirus has a very high infection rate, yet a moderately small mortality rate (2~3%). Still, if this virus continues to spread throughout the world and infects more and more people, there is a very real potential that 20 to 50 million people may be killed because of this event. It may become one of the biggest Black Swan events in recent history.
We really won’t know the total scope of the damage to the Chinese and Asian economies for another 35+ days – possibly longer. The information we have been able to pull from available news sources and from the Chinese press is that hundreds of millions are quarantined, the Chinese Central Bank is pouring capital into their markets in order to support their frail economy and, just recently, President Xi suggested stimulus will not be enough – austerity measure will have to be put into place to protect China from creating a massive debt-trap because of this virus.
Austerity is a process of central bank planners cutting expenses, cutting expansion plans, cutting everything that is not necessary and planning for longer-term economic contraction. It means the Chinese are preparing for a long battle and are attempting to protect their wealth and future from an extreme collapse event.
From an investor standpoint, FANG stocks have outperformed the S&P, NASDAQ and DOW JONES indexes by many multiples over the past 5~6 years. The chart below highlights the rally in the markets that originated in late 2016 (think 2016 US Presidential Election) and the fact that foreign capital poured into the US stock market chasing expected returns promised by future President Trump.
It becomes very clear that the FANG stocks rallied very quickly after the elections were completed and continued to pull away from valuation levels of the S&P, NASDAQ and DOW JONES US indexes. How far has the FANG index rallied above the other US major indexes? At some points, the FANG index was 30~40% higher than the biggest, most mature industries within the US. In late 2018, everything contracted a bit – including the FANG index.
As or right now, the FANG index has risen nearly 274% from October 2014. The S&P has risen nearly 60% over that same time. The NASDAQ has risen 140% and the S&P 500 Info Tech Index rose 180%. The reality is that capital has poured into the technology sector, FANG stocks and various other US stock market indexes chasing this incredible rally event.
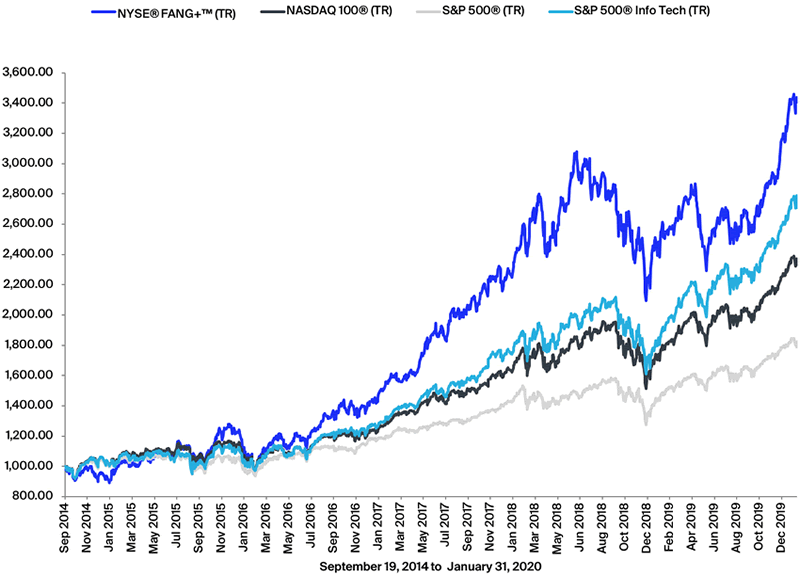
(source: https://www.theice.com/fangplus)
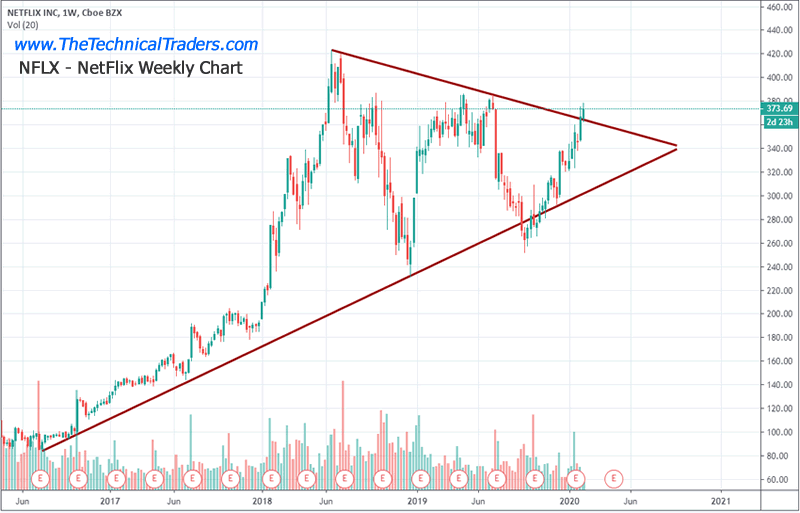
This Netflix Weekly chart highlights what we believe are some of the early signs of weakness in the FANG sector. The sideways FLAG formation suggests NFLX has reached a peak in early 2018 and investors have shied away from pouring more capital into this symbol while the Technology index and FANG index have continued to rally over the past 8+ months.
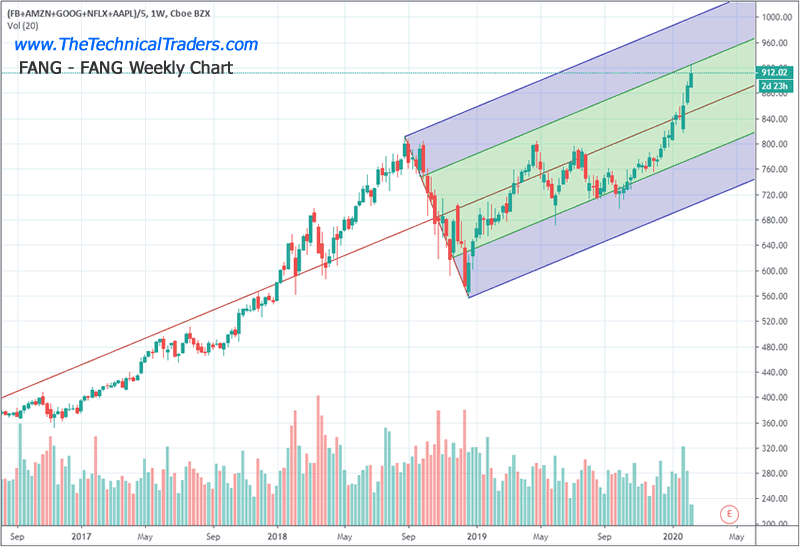
This Weekly Custom FANG Index chart highlights the rally that took place after October 2018 and continues to drive new highs today. This move on our Custom FANG index shows a very clear breakout rally taking place which is why we believe more foreign capital poured into the US markets as the US/China trade deal continued to plague the global markets and as BREXIT and other economic issues started to weigh on economic outputs. What did investors do to avoid these risks? Pour their capital into the hot US technology sector.
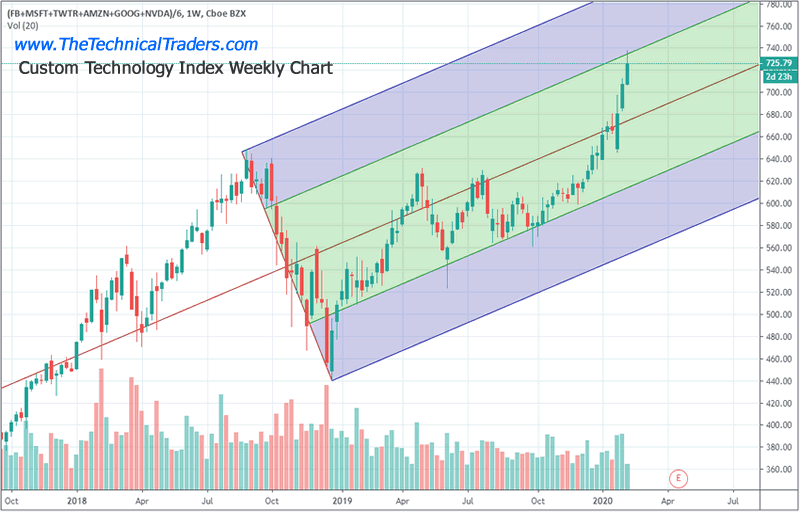
Another chart we like to review is our Custom Technology Index Weekly chart. This chart shows a similar pattern to the FANG chart above, yet it presents a very clear picture of the excessive price rally and rotation that has taken place over the past 5+ months. The real risk with this trend is that investors may start to believe “it will go on forever” and “there is no risk in these trades”. There is a very high degree of risk in these trades. Once the bubble bursts, the downside move may become very violent and shocking.
A reversion event, bubble burst event, in the technology sector as a result of the economic collapse in China and throughout other areas of the world may break this rally in the technology sector at some point and may push investors to re-evaluate their trading plans. Until investors understand the risks setting up because of the Coronavirus and the potential for a 20%, 30%, even 40% decrease in economic activity and consumer spending may finally push global investors to really think about the true valuations within the FANG/Technology sector.
We writing this article to alert you to the very real fact that “what goes up – must come down” at some point. Pay attention to how this plays out and what may cause global investors to suddenly change their opinion of the Technology sector. A pullback in this sector may result in a -40% to -50% price reversion.
We believe the economic collapse and humanitarian crisis that is unfolding in China may be enough to put a massive dent in future expectations for 2020 and 2021. You simply can’t have a major global economic collapse in this manner without having some type of cross-over event. As we learned in 2008-09 with the US credit crisis – when a major economy collapses its assets and financial markets, the ripples spread across the globe. China may become the next financial crisis event for the new decade.
Join my Swing Trading ETF Wealth Building Newsletter if you like what you read here and ride my coattails as I navigate these financial markets and build wealth while others lose nearly everything they own.
Chris Vermeulen
www.TheTechnicalTraders.com
Chris Vermeulen has been involved in the markets since 1997 and is the founder of Technical Traders Ltd. He is an internationally recognized technical analyst, trader, and is the author of the book: 7 Steps to Win With Logic
Through years of research, trading and helping individual traders around the world. He learned that many traders have great trading ideas, but they lack one thing, they struggle to execute trades in a systematic way for consistent results. Chris helps educate traders with a three-hour video course that can change your trading results for the better.
His mission is to help his clients boost their trading performance while reducing market exposure and portfolio volatility.
He is a regular speaker on HoweStreet.com, and the FinancialSurvivorNetwork radio shows. Chris was also featured on the cover of AmalgaTrader Magazine, and contributes articles to several leading financial hubs like MarketOracle.co.uk
Disclaimer: Nothing in this report should be construed as a solicitation to buy or sell any securities mentioned. Technical Traders Ltd., its owners and the author of this report are not registered broker-dealers or financial advisors. Before investing in any securities, you should consult with your financial advisor and a registered broker-dealer. Never make an investment based solely on what you read in an online or printed report, including this report, especially if the investment involves a small, thinly-traded company that isn’t well known. Technical Traders Ltd. and the author of this report has been paid by Cardiff Energy Corp. In addition, the author owns shares of Cardiff Energy Corp. and would also benefit from volume and price appreciation of its stock. The information provided here within should not be construed as a financial analysis but rather as an advertisement. The author’s views and opinions regarding the companies featured in reports are his own views and are based on information that he has researched independently and has received, which the author assumes to be reliable. Technical Traders Ltd. and the author of this report do not guarantee the accuracy, completeness, or usefulness of any content of this report, nor its fitness for any particular purpose. Lastly, the author does not guarantee that any of the companies mentioned in the reports will perform as expected, and any comparisons made to other companies may not be valid or come into effect.
Chris Vermeulen Archive |
© 2005-2022 http://www.MarketOracle.co.uk - The Market Oracle is a FREE Daily Financial Markets Analysis & Forecasting online publication.