


Copper & Bonds Telegraphed the 2020 COVID Stock Market Collapse
Stock-Markets / Stock Markets 2020 Dec 13, 2020 - 06:51 PM GMTBy: Chris_Vermeulen

A very interesting setup in both Copper and Bonds seemed to have telegraphed the collapse in the US stock market in early 2020. T-Bonds, which had been consolidating into a downward price channel prior to the COVID outbreak, suddenly broke through the downward price channel and started to accelerate higher. Copper, which is a fairly common commodity for building, infrastructure, and other uses, had been moving higher above a clear upward price channel, then suddenly broke lower in early 2020. Both Bond and Copper seemed to break these price channels nearly 20+ days before the US stock markets initiated their price decline on February 24, 2020.
My research team and I believe this setup is not inconsequential for technical traders. The breakdown in Copper represents a core “demand” failure, while the breakout in Bonds suggests risks are elevating. This is something we should continue to watch for in the future as Copper and Bond prices typically move before the US stock market begins to react.
THE 2020 COPPER/BONDS DIVERGENCE SETUP
The following Daily chart showing the setups and breakdowns/breakouts of the DOW, Copper and Bonds clearly show the early breakout in Bonds and the subsequent breakdown in Copper – nearly 20+ days before the INDU (Dow Jones Industrial Average) began to breakdown and accelerate lower.
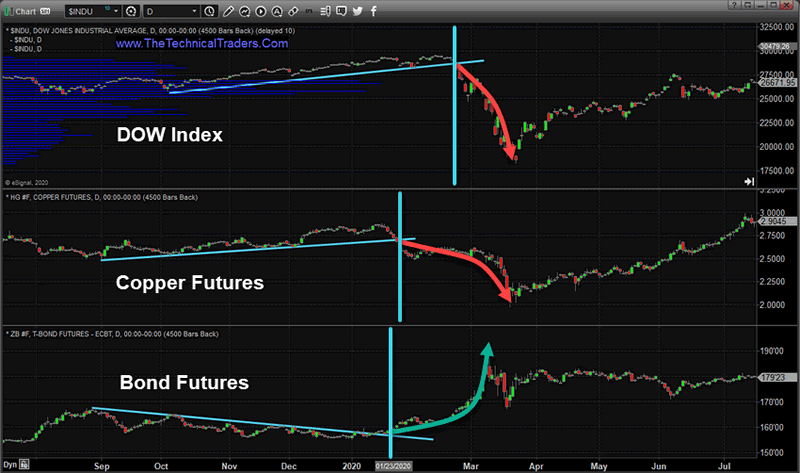
It makes sense that Bonds and a highly utilized commodity like Copper would reflect a change in demand or elevated fear just before a contagion event takes place. Consumers, manufacturers, and builders, as well as traders and investors, were all able to see the writing on the wall in this case. Will any future contagion event be similar? Will Copper and Bonds react to fears and demand concerns 10 to 20+ days before the next downside price event?
THE CURRENT COPPER/BONDS SETUP (STILL BULLISH)
Currently, the US markets are in a bullish price phase. We’ve written extensively about how the markets are experiencing an unprecedented bullish/rally phase which we believe to be a euphoric/speculative phase of the broader trend. Still, one can’t ignore the strength and momentum behind this current bullish trend and take a pessimistic view of the markets.
Be sure to sign up for our free market trend analysis and signals now so you don’t miss our next special report!
The Current INDU, Copper, and Bonds chart, below, highlights the strength and momentum of the current bullish INDU price trend. Even though Bonds appears to be very close to the downward sloping price channel, we have yet to see a real upside price trend in Bonds which would indicate fear has started to reengage in the markets. Additionally, Copper is trading solidly above the upward sloping price trend which suggests demand for copper is still quite strong.
As long as the bullish trend continues, we would expect Bonds to continue to consolidate below the downward sloping price trend and continue to drift lower while Copper continues to stay above the upward sloping trend line suggesting demand is strong and future expectations have not changed.
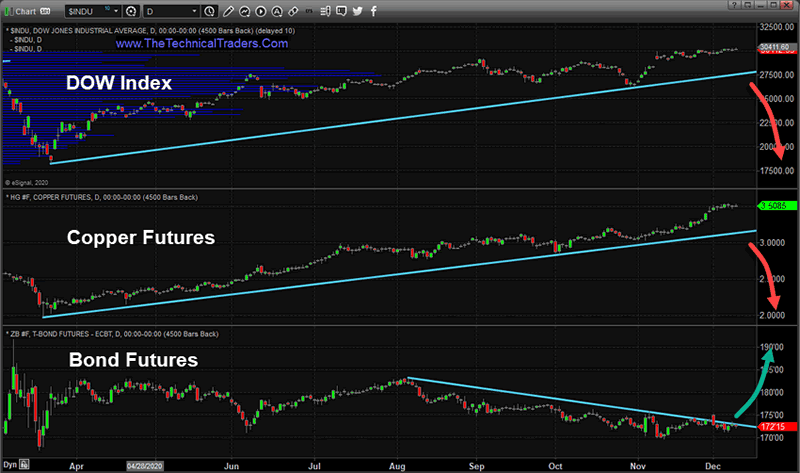
When and IF Bonds move above the downward sloping trend line, then we have to watch Copper very closely for a breakdown event. If we see this take place quickly (within a 5 to 7 day window), then we need to start to prepare for a broad market decline that may happen within 10 to 15+ days of the Bonds/Copper trigger date.
The arrows on the Current Chart above show you what would happen IF a new contagion event were to happen and IF the Copper/Bonds set up replicates itself. Bonds would begin to rally, Copper would begin to decline, and about 15+ days later, the US stock market would begin to decline.
Again, we believe this setup may be a good way to determine a change in expectations related to the demand for an industrial commodity (Copper) and risk levels related to debt/credit (Bonds) that may trigger a warning before the major markets change trends. If our research is correct, and the Copper/Bonds markets react to changing expectations before the broader US stock market reacts to the change in sentiment, then this may be a very valid setup for skilled technical traders to stay ahead of the major market trends.
To be clear, the markets are currently in a strongly bullish price phase. We are not calling for a top or any type of major downside rotation based on this setup today. We are showing you what happened prior to the 2020 breakdown and suggesting something similar may happen in the future – which may allow you to have an early warning of a major US stock market reversal in trend.
Either way, a skilled technical trader will be able to find success in an uptrend or a downtrend. Our proprietary BAN (Best Asset Now) strategy allows us to know which assets are potentially the best performers in any type of market trend. If you want to learn more about how we can help you with our proprietary tools, strategy, and daily analysis then go to www.TheTechnicalTraders.com to learn more.
Chris Vermeulen
www.TheTechnicalTraders.com
Chris Vermeulen has been involved in the markets since 1997 and is the founder of Technical Traders Ltd. He is an internationally recognized technical analyst, trader, and is the author of the book: 7 Steps to Win With Logic
Through years of research, trading and helping individual traders around the world. He learned that many traders have great trading ideas, but they lack one thing, they struggle to execute trades in a systematic way for consistent results. Chris helps educate traders with a three-hour video course that can change your trading results for the better.
His mission is to help his clients boost their trading performance while reducing market exposure and portfolio volatility.
He is a regular speaker on HoweStreet.com, and the FinancialSurvivorNetwork radio shows. Chris was also featured on the cover of AmalgaTrader Magazine, and contributes articles to several leading financial hubs like MarketOracle.co.uk
Disclaimer: Nothing in this report should be construed as a solicitation to buy or sell any securities mentioned. Technical Traders Ltd., its owners and the author of this report are not registered broker-dealers or financial advisors. Before investing in any securities, you should consult with your financial advisor and a registered broker-dealer. Never make an investment based solely on what you read in an online or printed report, including this report, especially if the investment involves a small, thinly-traded company that isn’t well known. Technical Traders Ltd. and the author of this report has been paid by Cardiff Energy Corp. In addition, the author owns shares of Cardiff Energy Corp. and would also benefit from volume and price appreciation of its stock. The information provided here within should not be construed as a financial analysis but rather as an advertisement. The author’s views and opinions regarding the companies featured in reports are his own views and are based on information that he has researched independently and has received, which the author assumes to be reliable. Technical Traders Ltd. and the author of this report do not guarantee the accuracy, completeness, or usefulness of any content of this report, nor its fitness for any particular purpose. Lastly, the author does not guarantee that any of the companies mentioned in the reports will perform as expected, and any comparisons made to other companies may not be valid or come into effect.
Chris Vermeulen Archive |
© 2005-2022 http://www.MarketOracle.co.uk - The Market Oracle is a FREE Daily Financial Markets Analysis & Forecasting online publication.