


Stock Market Trends Fortecast 2021
Stock-Markets / Stock Markets 2020 Dec 27, 2020 - 06:10 PM GMTBy: Chris_Vermeulen

Last year, I published a ‘What To Expect In 2020’ article that everyone seemed to enjoy. We published this article to help investors and traders prepare for what we believed was going to be an incredibly volatile 2020. Last year our conclusions was:
“Be prepared for a surprising spike in volatility in early 2020 with a moderately strong potential for an early 2020 downside price rotation which prompts a new price trend and possibly an early test of support (near 280 on the SPY chart). 2020 is going to be a fantastic year for skilled traders – get ready for some incredible price action. “
Our proprietary Adaptive Dynamic Learning (ADL) price modeling system has been calling big and unusual market price trends many months in advance over the past 3+ years. Some of the biggest trends the ADL predicted very accurately was the 2017~2018 rally in Gold and the 2019 collapse in Crude Oil.
Often, the ADL predictive modeling system predicts things that are so accurate, even 5+ months in advance, that it is difficult to believe. For example, with Crude Oil trading near $50, the ADL modeling system predicted that Oil prices would fall to levels near or below $22 in April/May 2020, then recover to levels above $51 within 60+ days thereafter. Remember, these predictions were made in July 2019 about price activity and targets for March through May 2020 – nearly 8+ months in advance. Click to see our original ADL predictions for Crude Oil.
Within this special end of the year 2020 article, we’re going to share with you what our ADP predictive modeling system suggests is the most likely outcome for the first 6+ months of 2021 across a number of charts, including the S&P500, the Nasdaq, the Dow, Gold and Silver.
S&P500 ADL 2021 Price Predictions
The ES Monthly chart below shows the highlighted YELLOW and RED areas that were highlighted by the ADL Predictive Modeling System. These results show that the S&P is likely to reach some early resistance in 2021, potentially stall and contract in early 2021 (near February/March) to levels near or below $2800~$3000, then resume a moderate upside price advance with prices staying near a range of $3400 to $3900.
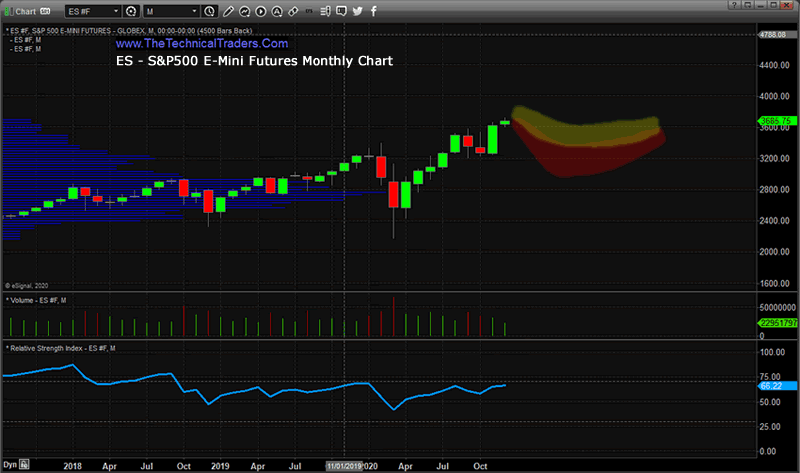
One thing you’ll see as a common thread across many of these US major index charts is the early price decline potential highlighted by the ADL Predictive Modeling System. It appears the ADL system is relatively confident that some type of downside price move will likely take place between February and April 2021, then a start a moderate price advance again..
NASDAQ ADL 2021 Price Predictions
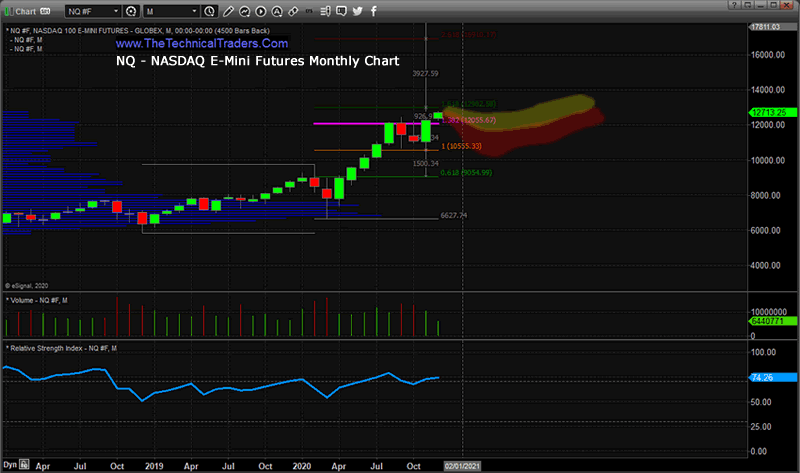
The following NASDAQ Monthly chart highlights a similar price range and activity from our ADL Predictive Modeling System. We see an early downside potential where price levels may reach or breach the $10,000 level in late Q1:2021 or early Q2:2021, followed by a sideways price range very similar to the last few months of 2020. Overall, it appears the NQ will trade within a $4000 to $5000 range in 2021 with a series of moderate price trend rotations starting in February or March 2021.
Be sure to sign up for our free market trend analysis and signals now so you don’t miss our next special report!
The biggest thing to remember about these ADL predictions is the RED area suggests the lower range of ADL predicted level and the YELLOW area suggests the higher range of ADL predicted levels. Thus, this total range on the chart (RED + YELLOW) are the potential expected price zones for 2021.
INDU ADL 2021 Price Predictions
The INDU Monthly chart below showing the ADL predictions represents one of the most telling examples of what may be a big price anomaly setting up in March or April 2021. The ADL system plotted a very deep price projection near $18,850 after the start of Q2:2021. The actual date of this trigger was closer to the end of Q2:2021 and near the start of Q3:2021. What we found interesting about this very deep ADL prediction was that predicted ranges prior to and just after this anomaly level was between $25k and $31k. Therefore, this very unusual prediction for the late Summer/early Fall of 2021 in the INDU suggests some type of fall out event is likely – prompting a potential -33% price collapse to take place.
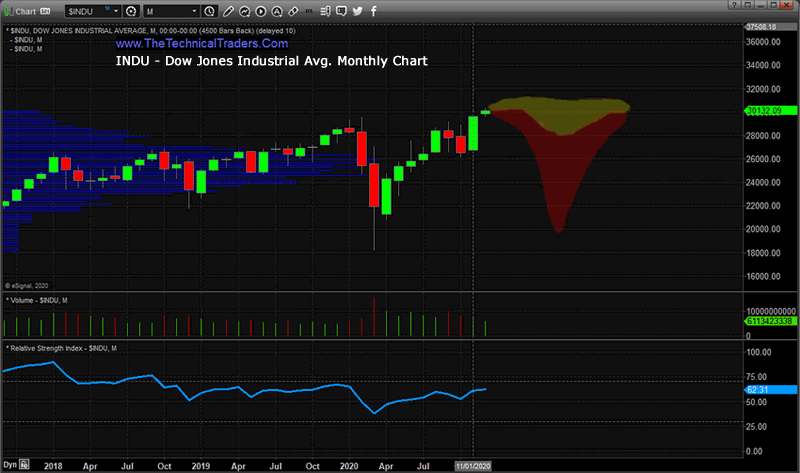
How we interpret this in comparison to the lack of any similar price trigger in the ES and NQ charts is that we look for other correlative ADL predictions in other symbols. We should also consider this a warning that the ES and NQ show ADL ranges that suggest a Q1 or Q2 moderate downside price potential whereas the INDU shows a Q2 or Q3 deeper downside price potential.
In Part II of this special ADL Predictive Modeling article for 2021, we will cover Gold, Silver, and the SPY, all of which will share even more detail about what to expect in 2021 and when. One thing is certain, 2021 is going to be a year for skilled traders that can quickly identify the best assets to trade. There are going to be some big swings in market prices and that means that various sectors will suddenly find themselves under severe pressure at different times throughout the year. These ADL predictions suggest the S&P500 and NQ will find price resistance fairly early in 2021, while the INDU may become the bigger, late-stage breakdown event.
All of this suggests we have to stay on our toes as the phases of the markets shift and new trends are established. This is why our BAN (Best Asset Now) technology is so important for continued growth and profits. Without the ability to actually know which assets are setting up to become top performers, one is simply guessing as to where to find profits/trends. Before you finish off last-minute shopping, join the Technical Trader service to start receiving my daily pre-market report that walks you through the charts of the major asset classes, identifying price support and resistance levels, patterns, and trade setups.
Chris Vermeulen
www.TheTechnicalTraders.com
Chris Vermeulen has been involved in the markets since 1997 and is the founder of Technical Traders Ltd. He is an internationally recognized technical analyst, trader, and is the author of the book: 7 Steps to Win With Logic
Through years of research, trading and helping individual traders around the world. He learned that many traders have great trading ideas, but they lack one thing, they struggle to execute trades in a systematic way for consistent results. Chris helps educate traders with a three-hour video course that can change your trading results for the better.
His mission is to help his clients boost their trading performance while reducing market exposure and portfolio volatility.
He is a regular speaker on HoweStreet.com, and the FinancialSurvivorNetwork radio shows. Chris was also featured on the cover of AmalgaTrader Magazine, and contributes articles to several leading financial hubs like MarketOracle.co.uk
Disclaimer: Nothing in this report should be construed as a solicitation to buy or sell any securities mentioned. Technical Traders Ltd., its owners and the author of this report are not registered broker-dealers or financial advisors. Before investing in any securities, you should consult with your financial advisor and a registered broker-dealer. Never make an investment based solely on what you read in an online or printed report, including this report, especially if the investment involves a small, thinly-traded company that isn’t well known. Technical Traders Ltd. and the author of this report has been paid by Cardiff Energy Corp. In addition, the author owns shares of Cardiff Energy Corp. and would also benefit from volume and price appreciation of its stock. The information provided here within should not be construed as a financial analysis but rather as an advertisement. The author’s views and opinions regarding the companies featured in reports are his own views and are based on information that he has researched independently and has received, which the author assumes to be reliable. Technical Traders Ltd. and the author of this report do not guarantee the accuracy, completeness, or usefulness of any content of this report, nor its fitness for any particular purpose. Lastly, the author does not guarantee that any of the companies mentioned in the reports will perform as expected, and any comparisons made to other companies may not be valid or come into effect.
Chris Vermeulen Archive |
© 2005-2022 http://www.MarketOracle.co.uk - The Market Oracle is a FREE Daily Financial Markets Analysis & Forecasting online publication.