


Another Stock Market Short-term Dip Ahead?
Stock-Markets / Stock Markets 2020 Feb 10, 2021 - 10:38 AM GMTBy: Andre_Gratian

Current Position of the Market
SPX Long-term trend: There is some good evidence that we are still in the bull market which started in 2009 and which could continue into the first quarter of 2021 before coming to an end.
SPX Intermediate trend: May continue until SPX reaches ~ 4150.
Analysis of the short-term trend is done daily with the help of hourly charts. They are important adjuncts to the analysis of daily and weekly charts which determine longer market trends.
Daily market analysis of the short-term trend is reserved for subscribers. If you would like to sign up for a FREE 2-week trial period of daily comments, please let me know at anvi1962@cableone.net
Another Short-term Dip Ahead?
Cycles: Looking ahead! 90-yr cycle – last low: 1932. Next low: 2022
7-yr cycle – last low: 2016. Next low: 2023
Market Analysis (Charts courtesy of QCharts
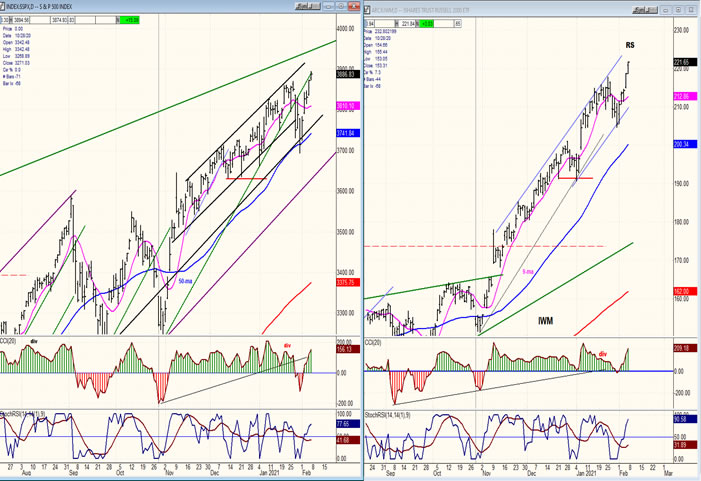
SPX-IWM daily charts
By continuing to show a lack of negative divergence to SPX, IWM is still telling us that we have not yet arrived at an intermediate peak in the market and that the new short-term dip which is currently expected will only be another minor correction on the way to a higher realm. This coincides with the March base P&F projection which suggests that a top of intermediate proportion should not be in place until we have reached 4150-4210 in the SPX.
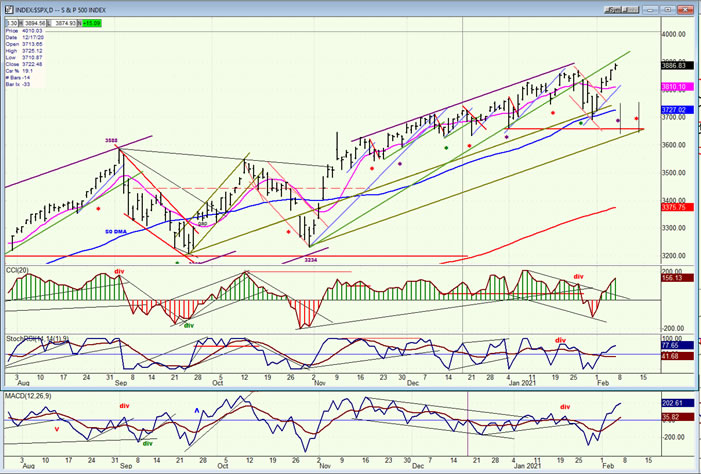
SPX daily chart
Despite warning from the negative divergence that had formed in the oscillators, which suggested that we could be ready for something more than a short-term correction, the pullback was brief, though steeper than anything since the start of the last intermediate uptrend (3234-10/30). The correction is now over, and SPX has reached a new high and is ready to continue its pattern of brief pullbacks followed by new all-time highs; that is, until it has reached the 4150-4210 level when this pattern could give way to our first substantial retracement since late October 2020.
For now, after reaching a new all-time high at 3894 on Friday, the index is ready for another short-term consolidation which could continue into 2/15 and reach about 3795. The downside projection is a rough estimate based on a potential 50% retracement of the previous rally. With a high occurring on Friday, there has not been enough time for a distribution pattern to form on the Point & Figure charts from which we can draw a count. Since a dip is likely early next week with a following bounce, by mid-week we may be positioned to determine a correction based on the P&F chart.
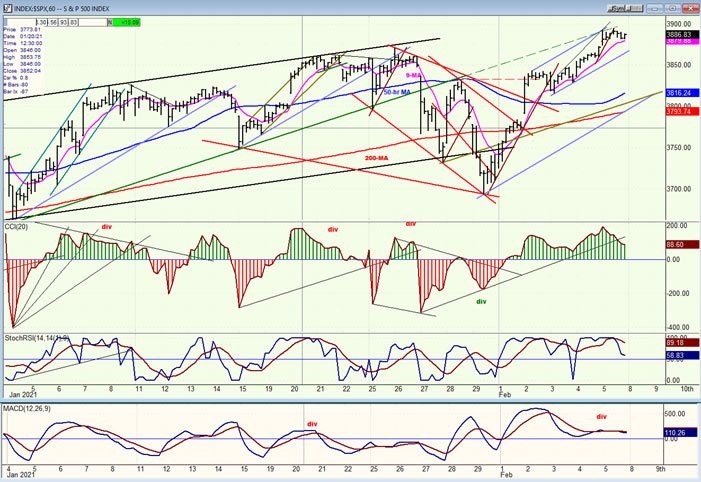
SPX hourly chart
The green trend line which I mentioned a couple of weeks ago is turning out to be a reliable guidepost for the SPX. Two weeks ago, after providing support for several weeks during which it was tested several times, the trend line finally gave way to the largest short-term correction since the beginning of the last intermediate trend. After making an initial low at the bottom of an ascending channel, a countertrend rally developed which found resistance precisely on the broken trend line. After completing its correction in a 3-phase pattern, SPX put on another good show of strength and wasted no time in making a new high, but look at where the rally stopped! On the broken trend line again!
Friday’s high is probably the top of the rally which should be followed by another short-term correction, repeating the pattern that was set into motion after the start of the new intermediate trend. Although we do not yet have confirmation that a high has been struck, the presence of two minor cycle lows directly ahead (the first potentially on Monday-Tuesday, and the next on about the 15th) makes Friday’s high likely -- although the lack of clear divergence in the oscillators warns of a possibility inversion in the first cycle.
The correction should start as soon as we come out of the small blue channel which denotes the second phase of the rally.
-
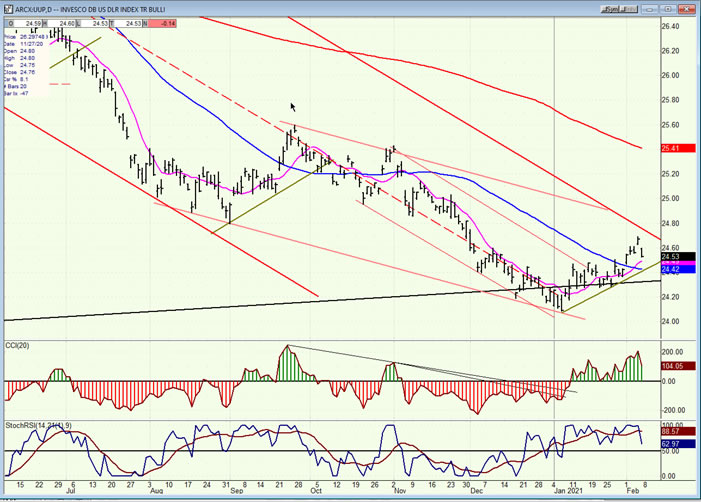
- UUP (dollar ETF) WKLY ($USD chart not available from this data provider)
- UUP has pushed a little higher in its recovery from a drop down to the major, long-term trend channel where it found support after a prolonged correction. Deceleration in that major downtrend gave notice of at least a rebound in prices. This was confirmed when the index broke above its 50-dma last week. It is likely that it will now move a little higher, perhaps even challenging the top trend line of its major corrective channel.
- GDX (gold miners)-DLY
- As expected, GDX continued to correct until it retested its recent low. It may now consolidate for another week or so at this level before attempting another move out of its corrective channel.
-

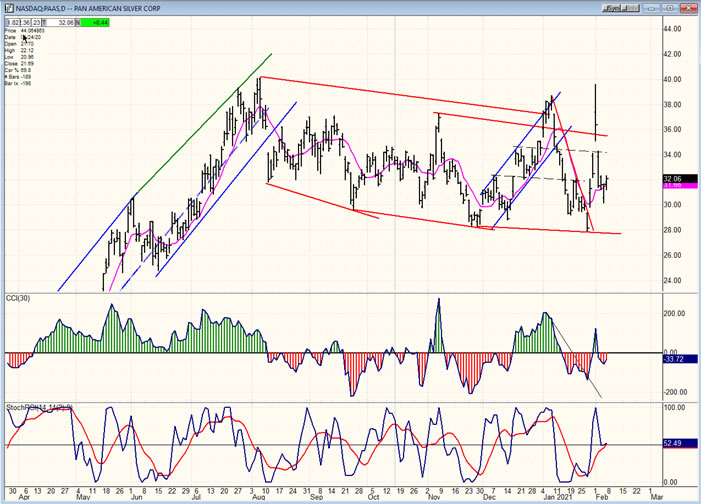
- PAAS (Pan American Silver Corp-DLY)
- PAAS had a premature break-out when silver became entangled in the short-covering fury which affected some speculative equities pushed on Reddit. The problem was that there were few shorts to panic in silver, and cycles were not ready for an important move. Consequently, PAAS could not follow through and quickly returned to its base where it should remain a little longer until a more genuine attempt at a rally can proceed.
-
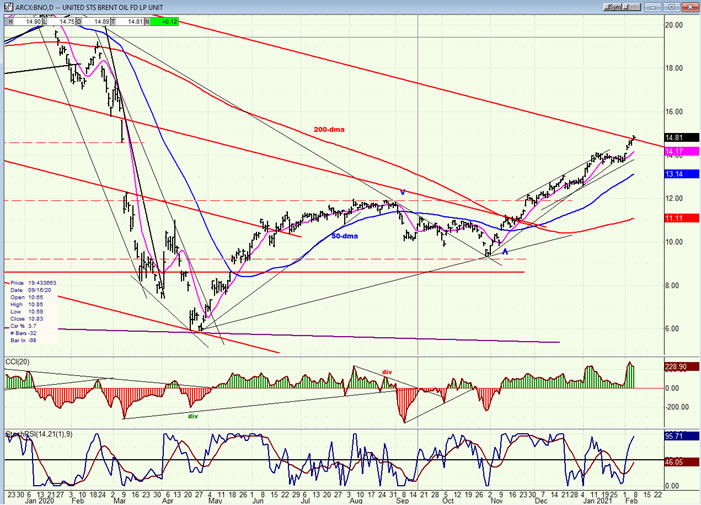
- BNO (U.S. Brent Oil fund)
- BNO has successfully surpassed two resistance lines and is now attacking the third one on its way to fulfilling a move to its price target of ~16 before it pauses in its short-term uptrend.
-
- SUMMARY
With the short-term correction over, SPX has moved on to making a new all-time high. But this should give way to another minor pull-back as the index continues its pattern of short-term higher highs and higher lows until it reaches its intermediate target of about 4150.
Andre
Free trial subscription
With a trial subscription, you will have access to the same information that is given to paid subscribers, but for a limited time-period. Over the years, I have developed an expertise in P&F charting (price projection), cycles (timing), EWT (structure), and general technical analysis which enables me to warn subscribers of pending reversals in market trends and how far that trend can potentially carry. For a FREE 2-week trial, subscription options and payment plans, I encourage you to visit my website at www.marketurningpoints.com.
Disclaimer - The above comments about the financial markets are based purely on what I consider to be sound technical analysis principles uncompromised by fundamental considerations. They represent my own opinion and are not meant to be construed as trading or investment advice, but are offered as an analytical point of view which might be of interest to those who follow stock market cycles and technical analysis.
Andre Gratian Archive |
© 2005-2022 http://www.MarketOracle.co.uk - The Market Oracle is a FREE Daily Financial Markets Analysis & Forecasting online publication.