


A Mixed Stock Market - Still
Stock-Markets / Stock Market 2021 Sep 06, 2021 - 10:28 PM GMTBy: Andre_Gratian

Current Position of the Market
SPX Long-term trend: There is some evidence that we are still in the bull market which started in 2009 and which could continue into 2021 until major cycles take over, and it ends. A move up to ~4500 is possible before the current bull market makes a final top and SPX corrects into its next major cycle low due in 2023.
SPX Intermediate trend: SPX correction underway.
Analysis of the short-term trend is done daily with the help of hourly charts. They are important adjuncts to the analysis of daily and weekly charts which determine longer market trends.
A Mixed Market -- Still
Cycles: Looking ahead!
7-yr cycle – Last lows: 2009-2016. Next low: ~2023
Market Analysis (Charts, courtesy of StockCharts)
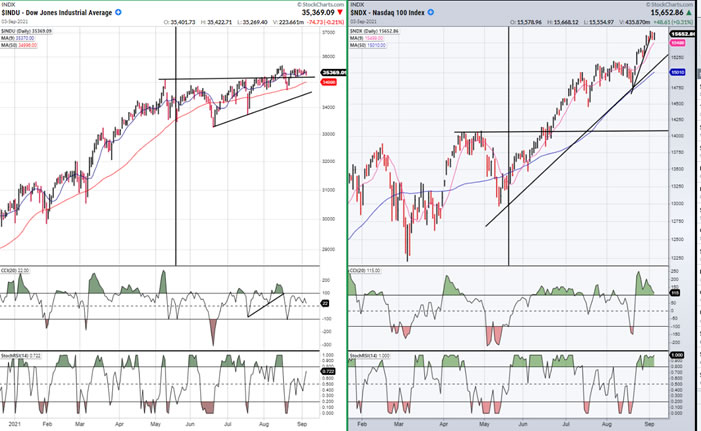
DJIA-NDX Daily
The two charts below make obvious the difficulty of analyzing the “market”—as a whole! Do you focus on the DJIA which has risen 4% since that vertical line was drawn on 5/18/21, or on the NDX which rose 17% during the same time period (a little over 4 months). And, if the Dow did not have MSFT and AAPL as its components, would it even have risen that much! The “POOR” S&P, which is caught in the middle as a hybrid of the two has to be seen as the most representative of the whole market, and this is why it has been, and continues to be the focus of our analysis.
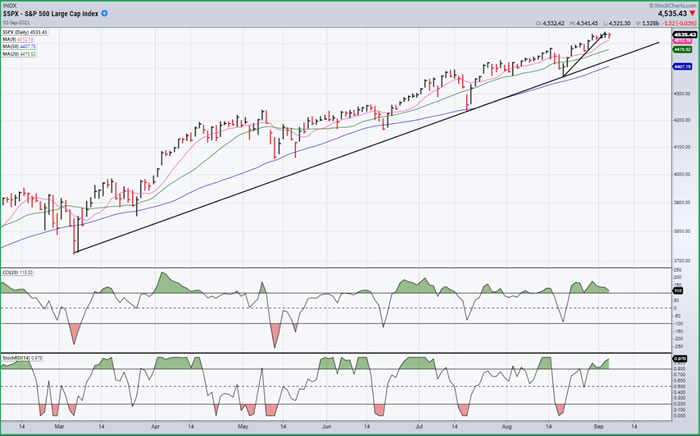
SPX daily chart
The trend from the March 2020 low has been so steep, that drawing a trend line from that low and connecting it with the latest correction low only produces two points and is therefore pretty much meaningless. That is why we have arbitrarily chosen to draw a trend line from the 3723-consolidation low, because it connects three points; and that makes it more reliable. I believe this is the trend line that will have to be broken before we can experience a significant correction in the “market”.
Now that we are getting very close to the 2020 P&F projection low of 4550, we may not have to wait too long before this takes place; although there is no guarantee that SPX will stop at that target, on the dime! P&F projections are best used as approximations, even though they, more than not, are filled exactly as projected, especially in smaller phase projections. Also, if you look at the DJIA chart above, it is obvious that it seems more and more ready for a reversal and, judging by the degree of deceleration which has been taking place since the current phase started in mid-June, it may not be too long before that occurs.
To that effect, it may behoove us to focus on the short-term trend and the current position of the short-term cycle, which is what we will do when we analyze the 60m chart, next!
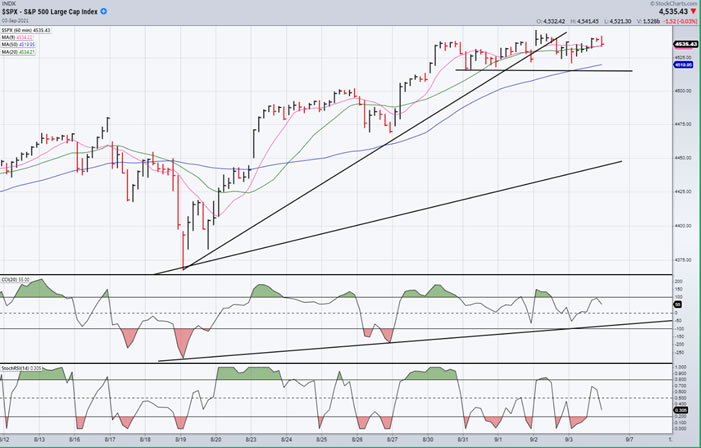
- SPX hourly chart
- SPX has a fairly regular short-term cycle which is shown on the chart below and puts the last cycle low on 8/19 at 4368. Since then, the index has risen about 167 points to 4535 and is about half-way through its cycle. The next low is anticipated to come in approximately two weeks. The deceleration which has taken place over the last week may be indicative of a topping formation, or it may simply be the effect of a mid-cycle pullback which was expected to occur in this time frame. It’s now a question of how much more of an upward push the second half of that cycle will produce. Short-term cycles are prone to being affected by news which has a catalytic effect on their phase and there is plenty of that to go around at this time, so let’s see if, for instance, Friday’s disappointing news report belatedly alters its performance in any way. Divergence has formed in the indicators but has not yet resulted in a sell signal. The price would have to drop below the horizontal line (4515) to show developing weakness which could start the cycle on its down phase.
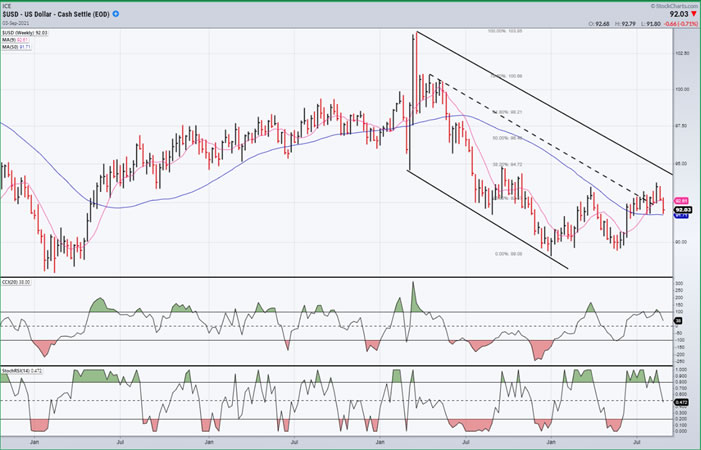
- USD (dollar) dly
- The dollar may have ended its attempt at challenging the corrective channel’s upper trend line, or it may simply be a pause in that process. A drop below the 50-dma which is currently providing support for the pullback could send the index back down toward the 90 lows.
-
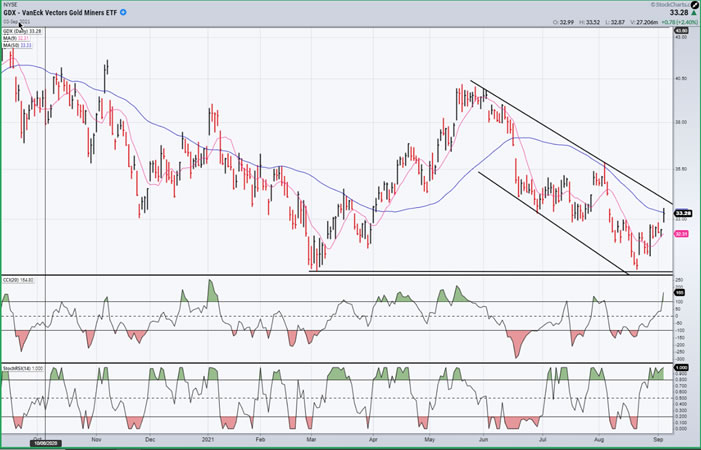
- GDX (gold miners) (dly)
- GDX is profiting from the pullback in the dollar and has risen to the top of its own corrective channel. It too has found resistance at the 50-dma, but Friday’s close was near the top of its daily range which makes Monday an important day to see if it can overcome the MA and challenge the top of the channel.
-
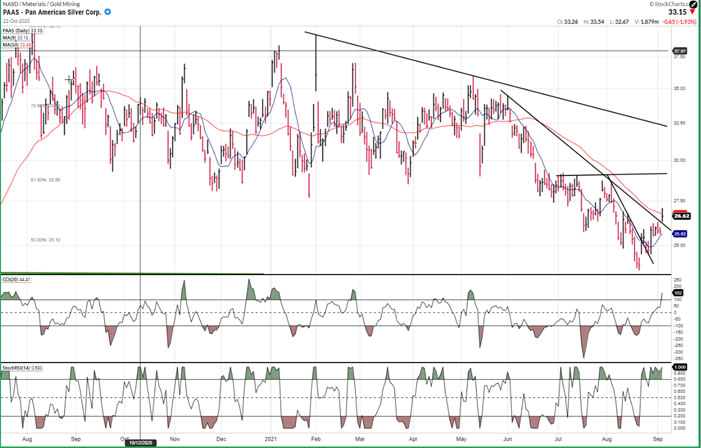
- PAAS (dly)
- PAAS has also profited from the retracement in the dollar and may be in a little stronger position than GDX because it has already risen well above its 50-dma and is trying to clear the 200-dma. Next week will be important for this index as well, to see if it can rise clear of the downtrend line which it has already broken.
-
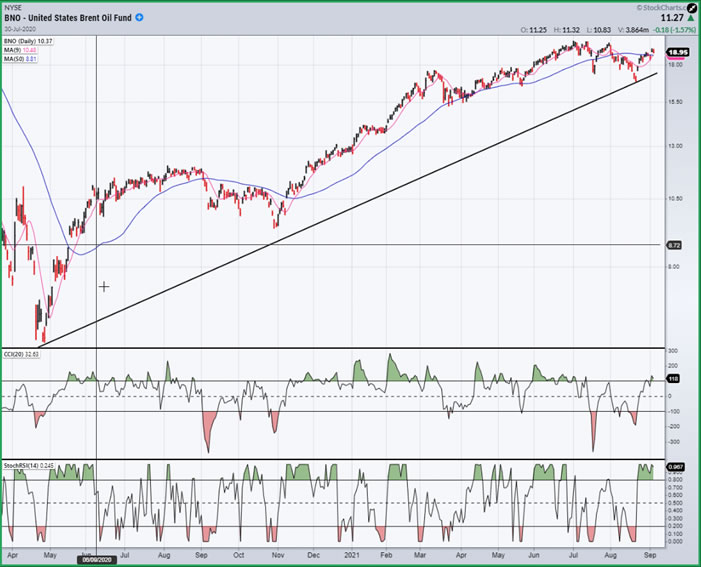
- BNO (Brent oil fund) dly
- BNO has reacted to the devastation in the oil industry caused by hurricane Ida. It has not yet conclusively established a new uptrend and may simply be expanding its top formation. The new trend line has been created which it has to hold.
-
- SUMMARY
- Last week stated: “SPX is drawing ever closer to its long-term projection of 4550”, and this is where the last week of trading has taken it. It can now choose to expand up to, or a little beyond it, depending on how much upward potential remains in the short-term cycle.
Andre
Free trial subscription
With a trial subscription, you will have access to the same information that is given to paid subscribers, but for a limited time-period. Over the years, I have developed an expertise in P&F charting (price projection), cycles (timing), EWT (structure), and general technical analysis which enables me to warn subscribers of pending reversals in market trends and how far that trend can potentially carry. For a FREE 2-week trial, subscription options and payment plans, I encourage you to visit my website at www.marketurningpoints.com.
Disclaimer - The above comments about the financial markets are based purely on what I consider to be sound technical analysis principles uncompromised by fundamental considerations. They represent my own opinion and are not meant to be construed as trading or investment advice, but are offered as an analytical point of view which might be of interest to those who follow stock market cycles and technical analysis.
Andre Gratian Archive |
© 2005-2022 http://www.MarketOracle.co.uk - The Market Oracle is a FREE Daily Financial Markets Analysis & Forecasting online publication.