


Omicron COVID Variant-Possible Strong Stock Market INDU & TRAN Rally
Stock-Markets / Stock Market 2021 Dec 07, 2021 - 01:45 PM GMTBy: Chris_Vermeulen

As we’ve been watching the markets recoil away from risks related to the new Omicron COVID variant and other factors, one simple thought keeps running through my head. What if the markets suddenly shift away from this panic selling and resume a rally/recovery trend – possibly pushing to new all-time highs before the end of the year?
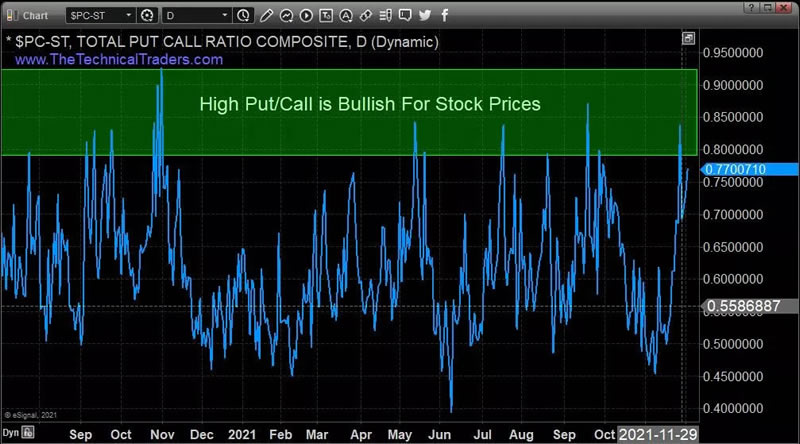
Recently, the Put/Call ratio reached a moderate-high near 0.84. I interpret this as long traders buying protection in the event of an extended breakdown in the US/global markets. In the past, typically, when the Put/Call ratio reaches levels above 0.80 – the markets are very close to a bottom.
Prior Downside GAPS Setup A Potential Rip-Your-Face-Off Rally
Next, I noticed the GAP in price on the Dow Jones Industrial Average and the Transportation Index. That got me thinking, “a sudden reversal in price, possibly resulting in a series of price squeeze events, may prompt a strong rally phase back above the GAP levels.” If this happens, we may see a 5% to 7% rally in the US markets take place to restart the Santa Rally phase.
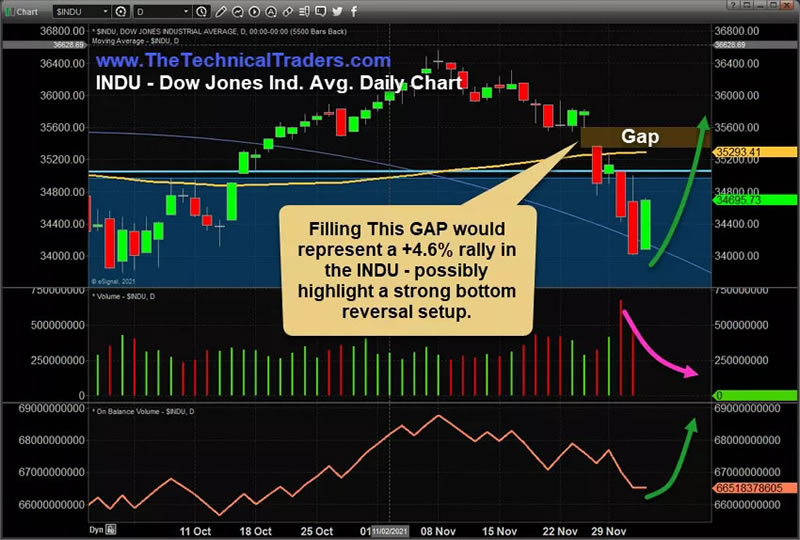
INDU Gap Near $35,600 May Become A Clear Upside Target
This Daily INDU chart shows the GAP I’m talking about and shows what I expect may happen if the markets shake off the Omicron fears and get back into bullish trending mode. It won’t take much to drive the INDU 7% higher from recent lows if fear subsides and traders pile into long positions expecting Q4:2021 to be strong and the Santa Rally to kick in.
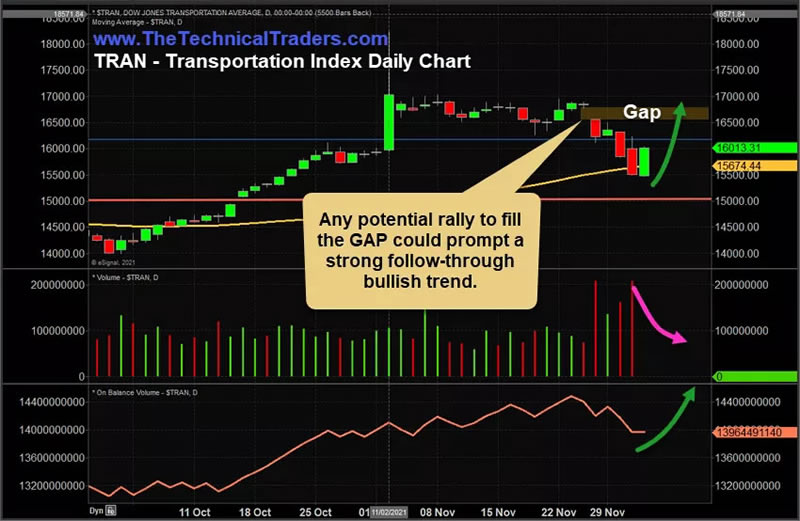
TRAN Gap Near $16,800 May Provide Additional Confirmation Of A Bullish Rally Phase
This Daily TRAN chart shows a similar GAP in price that could also trigger a big rally towards new all-time highs if the markets suddenly shift gears. The fear that settled over the global markets because of the Omicron virus strain may have pushed the markets into a fairly deep pullback. As we’ve seen repeatedly, when these pullbacks end, the US markets shift back into strong bullish price trending and often rally to new all-time highs.
This GAP on the TRAN chart may further confirm that the downside price pressure has ended and a new rally phase is setting up for the US markets.
Just a few days ago, I posted a research article showing results from a proprietary data mining utility I use that illustrated the typical bullish market strength in November and December. You can read that article here: Thetechnicaltraders.com.
Be sure to sign up for our free market trend analysis and signals now so you don’t miss our next special report!
I believe the global markets will attempt to move past the fear we’ve seen related to the Omicron virus strain. It is becoming more evident that many nations are already somewhat prepared to deal with it throughout December/January. If there is sudden news that it, or any new virus strain, is far more dangerous, things could change very quickly. But I believe the US markets are searching for support and are very likely to end 2021 at or near new all-time highs – supporting a very strong Santa Rally.
Watch for end-of-day SQUEEZE events to push price levels higher and higher over the next few days – possibly targeting these GAP areas or higher.
Want to learn more about what affects the markets?
Learn how I use specific tools to help me understand price cycles, set-ups, and price target levels. Over the next 12 to 24+ months, I expect very large price swings in the US stock market and other asset classes across the globe. I believe the markets are starting to transition away from the continued central bank support rally phase and may start a revaluation phase as global traders attempt to identify the next big trends. Precious Metals will likely start to act as a proper hedge as caution and concern start to drive traders/investors into Metals.
If you need technically proven trading and investing strategies using ETFs to profit during market rallies and to avoid/profit from market declines, be sure to join me at TEP – Total ETF Portfolio.
Have a great day!
Chris Vermeulen
www.TheTechnicalTraders.com
Chris Vermeulen has been involved in the markets since 1997 and is the founder of Technical Traders Ltd. He is an internationally recognized technical analyst, trader, and is the author of the book: 7 Steps to Win With Logic
Through years of research, trading and helping individual traders around the world. He learned that many traders have great trading ideas, but they lack one thing, they struggle to execute trades in a systematic way for consistent results. Chris helps educate traders with a three-hour video course that can change your trading results for the better.
His mission is to help his clients boost their trading performance while reducing market exposure and portfolio volatility.
He is a regular speaker on HoweStreet.com, and the FinancialSurvivorNetwork radio shows. Chris was also featured on the cover of AmalgaTrader Magazine, and contributes articles to several leading financial hubs like MarketOracle.co.uk
Disclaimer: Nothing in this report should be construed as a solicitation to buy or sell any securities mentioned. Technical Traders Ltd., its owners and the author of this report are not registered broker-dealers or financial advisors. Before investing in any securities, you should consult with your financial advisor and a registered broker-dealer. Never make an investment based solely on what you read in an online or printed report, including this report, especially if the investment involves a small, thinly-traded company that isn’t well known. Technical Traders Ltd. and the author of this report has been paid by Cardiff Energy Corp. In addition, the author owns shares of Cardiff Energy Corp. and would also benefit from volume and price appreciation of its stock. The information provided here within should not be construed as a financial analysis but rather as an advertisement. The author’s views and opinions regarding the companies featured in reports are his own views and are based on information that he has researched independently and has received, which the author assumes to be reliable. Technical Traders Ltd. and the author of this report do not guarantee the accuracy, completeness, or usefulness of any content of this report, nor its fitness for any particular purpose. Lastly, the author does not guarantee that any of the companies mentioned in the reports will perform as expected, and any comparisons made to other companies may not be valid or come into effect.
Chris Vermeulen Archive |
© 2005-2022 http://www.MarketOracle.co.uk - The Market Oracle is a FREE Daily Financial Markets Analysis & Forecasting online publication.