


Global Stock Markets Contagion Blowback
Stock-Markets / Elliott Wave Theory Oct 27, 2008 - 04:00 AM GMTBy: Joseph_Russo

 From GLOBAL CONTAGION April 26, 2006
“A highly deceptive global contagion of the bullish kind appears well underway”
“The basic concept of meeting the demands of large growing populations with finite world resources has always been one of extreme challenge and controversy.
The prospect of accommodating such demands becomes even more challenging when sustained bursts of regional growth at the periphery manifest themselves upon pillars of artificial demand engineered from the center.
Competition for distribution of wealth and resources appears to be the basis from which many of globalizations challenges currently resonate.
A perceived, never-ending supply of cheap goods and labor tied to exports together with an abundance of natural resources embodies many of the power structures at the periphery.
In kind, a perceived never-ending supply of consumers and credit tied to imports together with an abundance of military force embodies much of the power structure at the centers.”
“As competitive dynamics mature, the prospects of sustaining such arrangements indefinitely diminish considerably.”
“The one tenet of Elliott Wave Theory that surfaces time and again in our “contagion” analysis is that of the fifth wave extension at intermediate degree or higher.
The propensity for fifth waves to extend has been quite rare in recent decades. Back in the late 1800's through the late 1930's, there appears to be sufficient evidence that stocks tended to stretch their final runs.
It also seems to have been Elliott's general preference to anticipate that the fifth wave of an impulsive advance would often pack the biggest punch by way of “stretching” or “extending”.
From the ‘40's through the 80's this has not generally been the case. Today, it is more common to anticipate that it will be the “third” wave and not the fifth that holds the higher probability of extending the stock indices.
Given the price action across a broad array of global equity indices, it is difficult for us NOT to consider the probability that extended fifth waves are currently under way in many global equity indices.”
April 26, 2006
ILLUSTRATION: Fifth Wave Extension at Intermediate Degree
From SCALING PERCEPTIONS AMID THE GLOBAL EQUITY BOOM November 15, 2006
“ The goal of this piece is to assist in broadening perspectives of general perception relative to amplitudes, durations, and numerous degrees of trend currently at work in the global market place. ”
AUSTRALIA
November 15, 2006 LOG-SCALE ARITHMETIC SCALE
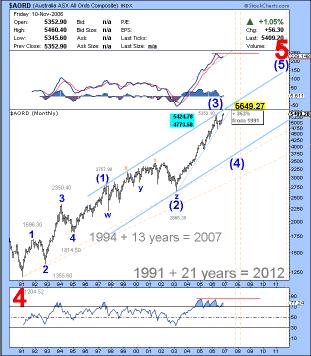
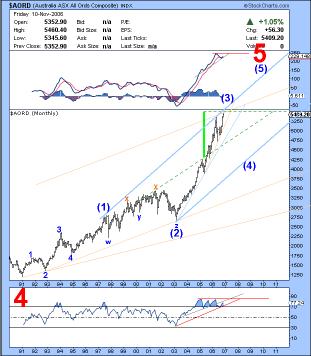
Revisiting the ASX All Ordinaries Composite
Two years ago in November of 2006, we were anticipating a topping process to an intermediate degree (3) wave believed to be in progress. As noted by our postulated (4) wave at the lower trend channel in each of the charts above, the anticipated (4) wave was expected to be sharp, and deep. During the final thrust of the bullish portion of the “mass global contagion”, this anticipated sharp wave (4) down failed to exert itself with adequate depth or duration. Instead, after extremely shallow and brief pullbacks, stocks resumed shooting for the stars right until the top tick (nearly a year ago) in November of 2007. The 50% CRASH-LIKE decline illustrated in the aftermath below leaves us with either of two plausible wave counts. Of the two, the one in keeping with the “extended fifth-wave” architecture illustrated in the lead chart, the log scale count to the left appears most visually fitting thus far.
October 24, 2008 LOG-SCALE ARITHMETIC SCALE
INDIA
November 15, 2006 LOG-SCALE ARITHMETIC SCALE
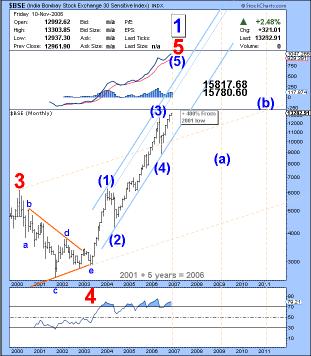
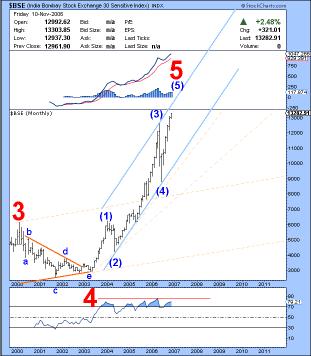
Revisiting India's BSE Index
In contrast to the extended fifth wave scenario, in the above charts presented in 2006, we had positioned India's stock index as having completed a satisfactory (4) wave pullback at Intermediate degree. As such, we were anticipating the BSE would deliver one last thrust higher in terminating its (5) wave prior to succumbing to a primary bear market. Our anticipated peak in 2006 extended by one turn-unit (in this case a year) as the Global Equity boom floated all boats in general unison. In both the LOG and ARITHMETIC chart updates below, we see the year-long decline breaching more than a 62% retracement of the entire advance from primary wave 4 in 2002. Thus far the decline is near a level at which an interim rebound of sorts would typically be expected. As noted, we suspect the primary bear market in progress can last well into the 2011 period.
October 24, 2008 LOG-SCALE ARITHMETIC SCALE
RUSSIA
November 15, 2006 LOG-SCALE ARITHMETIC SCALE
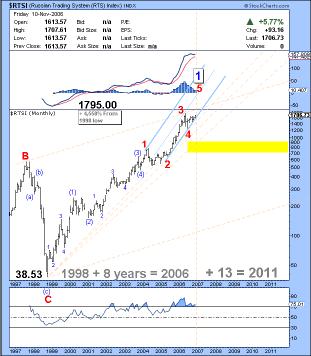
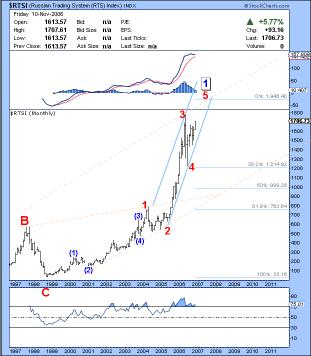
Revisiting Russia's RTSI Index
Given the collapse of the Soviet Empire in the late 90's, our 2006 view, as presented in the above charts, speculated that the “new” Russia was at the time, embarked upon terminating a most remarkable first wave up at CYCLE dimension. We maintain this opinion. Of interest is the stark difference in the appearance of LOG vs. ARITHMETICALLY scaled price data. The updated charts below show that the Arithmetic Scale was indeed the proper way to have perceived the RTSI back in 2006. Also, note how the intermediate (5) of 5 wave extended in its telltale whirlwind expanding wedge of chaos prior to crashing like a stone.
October 24, 2008 LOG-SCALE ARITHMETIC SCALE
BRAZIL
November 15, 2006 LOG-SCALE ARITHMETIC SCALE
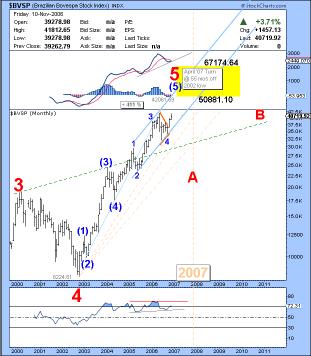
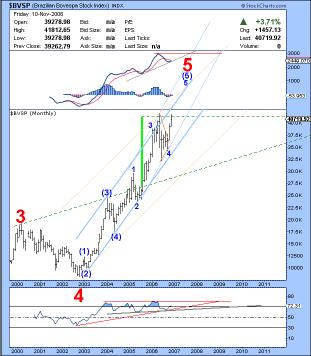
Revisiting the Brazilian Bovespa
Like India, the Bovespa was another such index believed to be on the cusp of a final advance back in November of 2006. Two years ago, we had postulated that a minor degree 5 th wave up was in progress. With the Bovespa trading near the 40K level at the time, we calibrated placement of the larger (5) terminal in the 50K – 67K range along with noting 2007 as a potential turn-year. In the follow-up summary below, note that only the Arithmetic Scale is able to adequately portray a chaotic extension of an expanding wedge (similar to Russia's) leading up to the final crest of the primary 5 th wave terminal. It is worth noting again how the Arithmetic Scale better reflects the harsh reality and severity of the recent crash, while the LOG scale to the left provides a false visual perception that not too much damage occurred, and that the market has a much better chance to reclaim new historic highs from current levels.
October 24, 2008 LOG-SCALE ARITHMETIC SCALE
MEXICO
November 15, 2006 LOG-SCALE ARITHMETIC SCALE
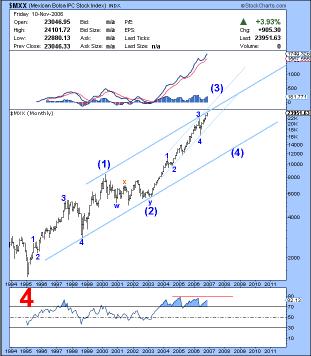
Revisiting the Mexican Bolsa
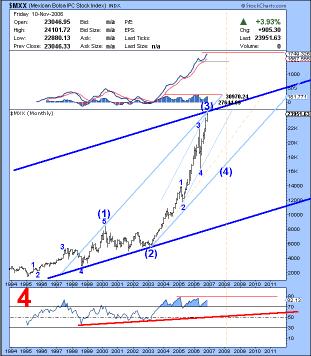
The Bolsa is perhaps the most perplexing of all the indices relative to its LOG vs. ARITHMETIC visual disposition. Two years ago, both scales were calling for the same outcomes. In our 2006 Arithmetic study (above right) we were fully anticipating a sharp and fast decline toward the (4) wave terminal. We even placed a vertical dashed line at the 2008 period to capture such a rapid decline near the 22K level. Fast forward to October 2008 (below right) and we see that at the 17K level, there is overwhelming evidence that the Arithmetic count is visually flawed in its expectation of a (4) wave down. In contrast, and despite a deceptive 50% retracement of the entire advance from 1995, the updated log scale (below left) thus far maintains perfect parallel trend channel alignment with an appropriate (4) wave consolidation amid an ongoing primary bull market. Which of these IDENTICAL charts should one trust to deliver a (5) wave recovery to fresh historic highs? If you answered neither, you are quite correct. The only thing one can trust is the day-to-day, week-to-week, month-to-month price action. If we have learned anything at all from the current crisis, FAITH and TRUST like HOPE and COMPLACENCY, have no place in long-term perceptions.
October 24, 2008 LOG-SCALE ARITHMETIC SCALE
THE WORLD
November 15, 2006 October 24, 2008
Revisiting the Dow Jones World Stock Index
Approaching test of a 16-year trend line from 1991, along with a violent 50% crash of its entire value , leaves no doubt that Global Equities are entrenched in a Primary Bear Market Event, likely within the confines of CYCLE-DIMENSION, which would equate to a long-term SECULAR BEAR MARKET ENVIRONMENT.
When it comes to strategically trading broad market indices, there is simply no match for Elliott Wave Technology's Near Term Outlook . We will gladly challenge any short-term advisory service or software generated algorithms that claim to outperform our consistent and impartial mapping of the price action in the Dow, S&P, or NDX.
Over the past three years, we have perfected the art of dispatching tactical trade set-ups and market forecasting to a consistent, impartial, and immensely profitable endeavor for those who take the time to embrace it.
The express focus of Elliott Wave Technology's charting and forecasting service is to help traders anticipate price direction and amplitude of broad market indices over the short, intermediate, and long-term.
We deliver this unique blend of proprietary charting protocol daily, with the express intent to convey timely and profitable information. Our daily reports impart strategy-specific guidance , which strives to forecast, monitor, and calibrate market impact relative to a multitude of signals that are in direct alignment with eight distinct trading strategies set forth in the members NTO essentials file.
Regardless of one's level of experience, users must allow sufficient time to become acquainted with the authors charting protocol, strategies, and tactical narratives prior to entering positions or developing discretionary trading strategies.
If you trade in today's increasingly uncertain and volatile markets, you need a reliable and consistent edge you can count on. If you want the very best, there is no better short-term advisory than the Near Term Outlook.
Trade Better / Invest Smarter...
By Joseph Russo
Chief Editor and Technical Analyst
Elliott Wave Technology
Email Author
Copyright © 2008 Elliott Wave Technology. All Rights Reserved.
Joseph Russo, presently the Publisher and Chief Market analyst for Elliott Wave Technology, has been studying Elliott Wave Theory, and the Technical Analysis of Financial Markets since 1991 and currently maintains active member status in the "Market Technicians Association." Joe continues to expand his body of knowledge through the MTA's accredited CMT program.
Joseph Russo Archive |
© 2005-2022 http://www.MarketOracle.co.uk - The Market Oracle is a FREE Daily Financial Markets Analysis & Forecasting online publication.