


BP Oil Stock Bullish Formation and Its Consequences
Commodities / Oil Companies Jan 27, 2024 - 06:41 PM GMTBy: Submissions
 The combination of supports and a candlestick formation encouraged the bulls to fight.
How high could stock go?
Last week turned out to be a breakthrough for the bulls. They managed to maintain important support, which attracted buyers to the trading floor and resulted in further positive technical changes. How high can the bulls climb in the following days? You will find the answer to this question in the article below. Have a nice read.
The Underpinnings of BP's Recent Surge
In the previous comment on BP published on Jan. 17 you could read the following:
(…) when we take a closer look at the chart (…), we can see that the space for further declines may be limited as not far from current levels, the bulls may find support.
(…) quite close to yesterday’s low, there is a red dashed declining line, which is a lower border of the red declining channel, which could encourage the buyers to trigger a rebound in the near future.
This scenario is also reinforced by the fact that the bears realized the pro-declining scenario described in the last article on BP, which suggests that they may be satisfied with the gains they have made and refrain from further strong attacks.
Additionally, the current position of the indicators suggests that higher prices may be just around the corner as the CCI remains in its oversold area while the Stochastic Oscillator generated a buy signal. At this point, it is worth noting that such low readings of the indicators we saw at the beginning of November.
(…) such low readings preceded the reversal, which suggests that similar price action may be just around the corner. However, before this happens, the bulls will have to show strength and prove that they are ready to fight for higher levels.
From today’s point of view, we see that the situation developed in line with the above scenario, and the price reversed and rebounded in the following days.
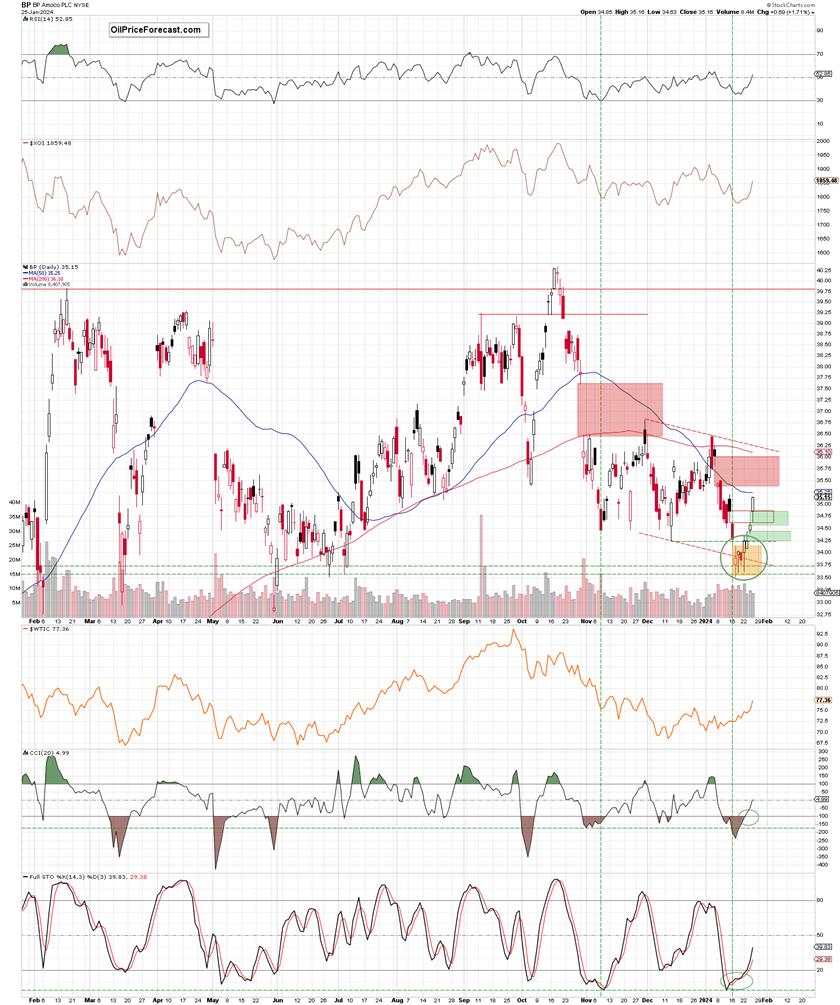
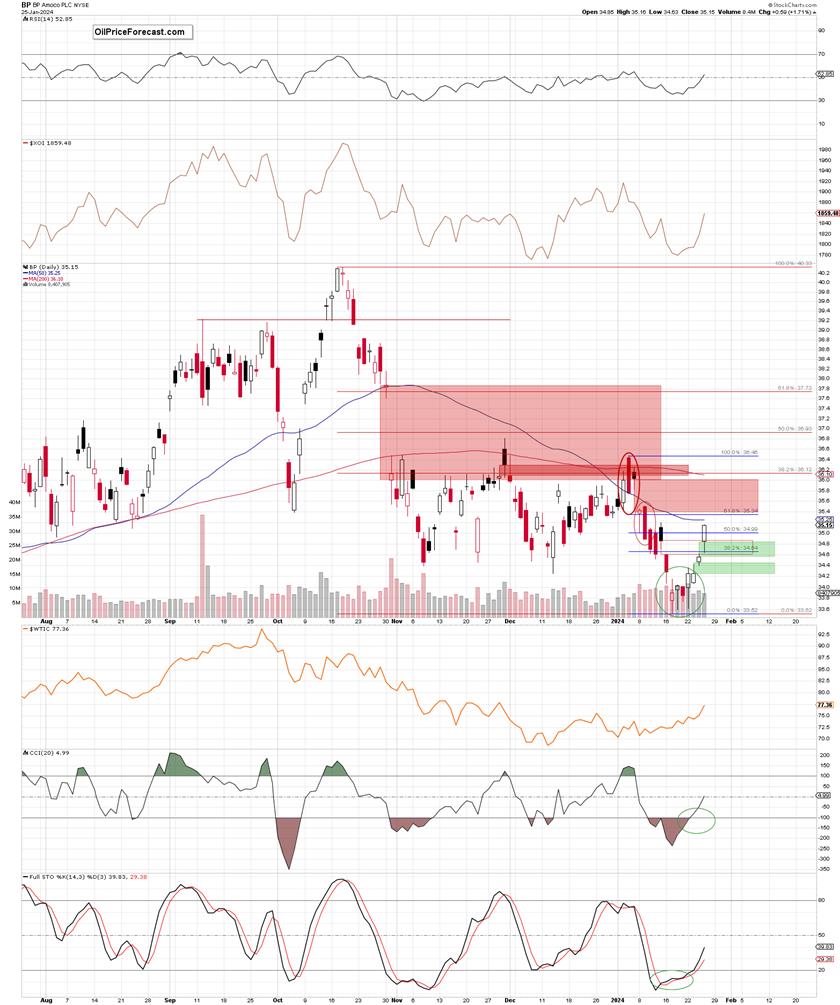
As you see on the daily chart, although the bears extended losses in the previous week, the combination of the lower border of the red declining channel (marked with dashed lines) and the support area based on the late-Jun. and early-Jul. lows (marked with green horizontal dashed lines) encouraged the bulls to fight.
They started a consolidation in this support area, which allowed them to gather enough strength to attack the higher levels. As a result, the price broke above the upper line of the formation and then jumped even higher, creating a green supportive gap (34.25-34.47) on Jan.24.
Thanks to this price action, an island reversal candlestick pattern (marked with a green ellipse on the chart) appeared on the chart, giving the bulls one more important reason to act. We didn't have to wait long for the effects because the next session opened with another green pro-growth price gap (34.56-34.85) and the stocks finished the day above 35.
When we take a look at the chart below, we can also notice that the recent upward move closed not only the red gap from Jan.17, but also the red gap created on Jan 16. and pushed the price above the 50% Fibonacci retracement based on the Jan. decline.
What’s next?
Taking into account all the above-mentioned bullish factors and combining it with the buy signals generated by the indicators, it seems that further improvement is very likely.
How high could stocks go?
In my opinion, the first upside target for the bulls would be around 35.34-35.51, where the nearest resistance zone (created by the lower border of the big red gap [35.37-36.03] from Jan.8, the 61.8% Fibonacci retracement [based on Jan. decline] and reinforced by the bearish engulfing pattern from Jan.9) is.
If this strong area will not discourage the bulls from fighting and it will not activate the bears, we could see an attack on the upper border of the mentioned gap, which is slightly below the next very strong resistance area created by two red gaps: from Oct.31, 2023, and Dec.1, 2023, which was strong enough to stop the buyers several times in the previous months.
At this point, it is worth noting that currently it is also reinforced by the bearish dark cloud candlestick pattern formed on Jan.4 and the 38.2% Fibonacci retracement (based on the entire Oct.-Jan. downward move), which makes it a key short-term resistance, the breach of which may open the way to higher levels. However, in my opinion, as long as it remains in the cards, a reversal in this area should be taken into account.
Summing up, the combination of supports and a pro-growth candlestick formation encouraged the bulls to fight for higher prices, which resulted in a quite sharp rebound and closing pro-bearish gaps and forcing the 50% Fibonacci retracement, which opened the way to the north. Therefore, further improvement and attack on the next resistances is very likely in the coming days.
If you’d like to know what the current technical picture of crude oil is or to find out what arguments the bulls have or what allies do the bears have, I encourage you to subscribe to Oil Trading Alerts, where you’ll find the answers to these (and many other) questions.
Have a wonderful weekend and see you on Monday.
Thank you.
Anna Radomski
Founder, Editor-in-chief
Tools for Effective Gold & Silver Investments - SunshineProfits.com
Tools für Effektives Gold- und Silber-Investment - SunshineProfits.DE
* * * * *
About Sunshine Profits
Sunshine Profits enables anyone to forecast market changes with a level of accuracy that was once only available to closed-door institutions. It provides free trial access to its best investment tools (including lists of best gold stocks and best silver stocks), proprietary gold & silver indicators, buy & sell signals, weekly newsletter, and more. Seeing is believing.
Disclaimer
All essays, research and information found above represent analyses and opinions of Przemyslaw Radomski, CFA and Sunshine Profits' associates only. As such, it may prove wrong and be a subject to change without notice. Opinions and analyses were based on data available to authors of respective essays at the time of writing. Although the information provided above is based on careful research and sources that are believed to be accurate, Przemyslaw Radomski, CFA and his associates do not guarantee the accuracy or thoroughness of the data or information reported. The opinions published above are neither an offer nor a recommendation to purchase or sell any securities. Mr. Radomski is not a Registered Securities Advisor. By reading Przemyslaw Radomski's, CFA reports you fully agree that he will not be held responsible or liable for any decisions you make regarding any information provided in these reports. Investing, trading and speculation in any financial markets may involve high risk of loss. Przemyslaw Radomski, CFA, Sunshine Profits' employees and affiliates as well as members of their families may have a short or long position in any securities, including those mentioned in any of the reports or essays, and may make additional purchases and/or sales of those securities without notice.
© 2005-2022 http://www.MarketOracle.co.uk - The Market Oracle is a FREE Daily Financial Markets Analysis & Forecasting online publication.