


US Stock Market Addicted to Deficit Spending
Stock-Markets / Stock Markets 2024 Feb 07, 2024 - 08:56 PM GMTBy: Nadeem_Walayat

Dear Reader
Firstly my latest video explaining how I accumulate and distribute (Trim) stock positions to maximise profits
Major Market lows by Calendar Month
This table proved remarkably accurate on it's own for pointing towards swing lows in March and October of 2023. Whilst June had a much lower probability and thus did not factor into my forecast expectations, despite at the time everyone wanting the market to make a low contrary to the road map which forecast a continuing uptrend into July.
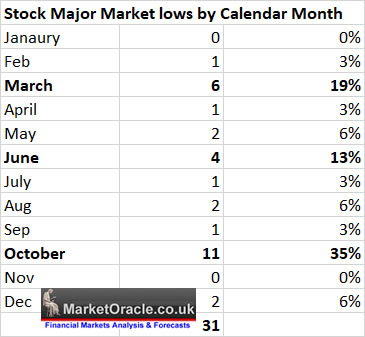
So last year we got 2 swing lows, what about 2024? I suspect we will see THREE SWING lows, again in March, June and October. Which thus suggests to expect a weaker stock market trend during 2024, i.e. doubt we come close to 2023's +25% on the S&P.
US Exponential Budget Deficit
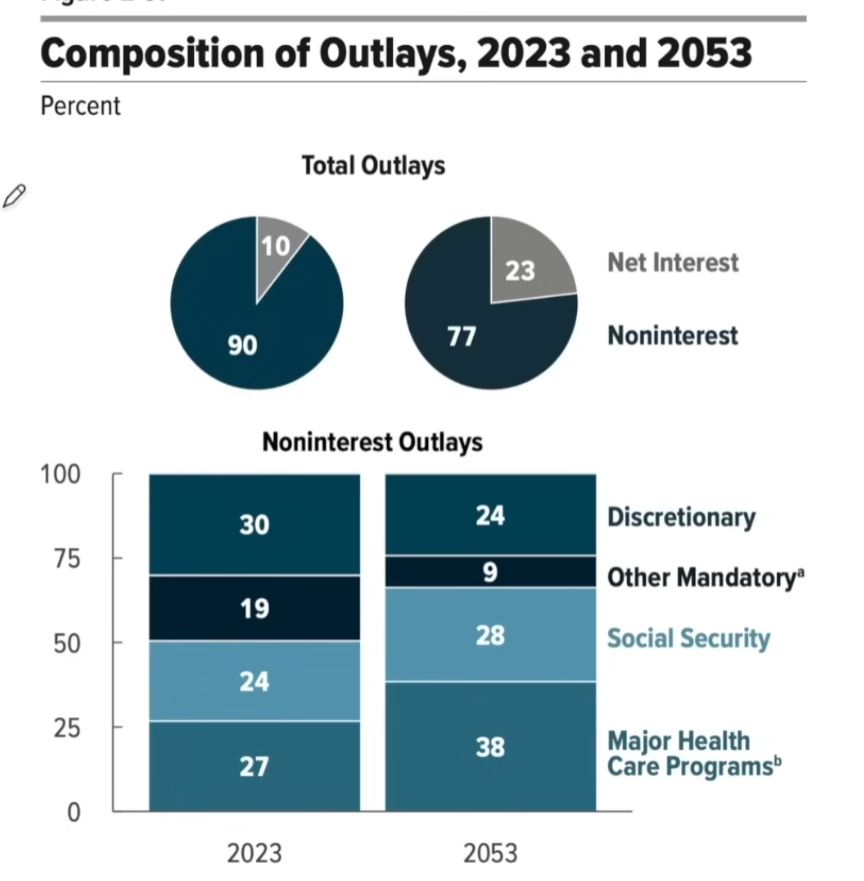
The US Congress Budget Office report projects the US deficit as a percentage of GDP being on an explosive trend trajectory which is as a function of the US government borrowing money to spend on consumption resulting in an ever interest payments and debt mountain. Folks we are looking at an out of control debt spiral, as interest on debt continues to result in the printing of even more new debt.
Whilst all those who state that the US is going to bankrupt in the wake of soaring deficits fail to understand that the US can literally print as many dollars to service the debt, which is what they have been doing the price for which is INFLATION. The US Empire by virtue of it's military loot the world of resources, people (brain drains) and wealth such as via imposing extortionate fines, the likes the $4.2 billion fine on Binance.
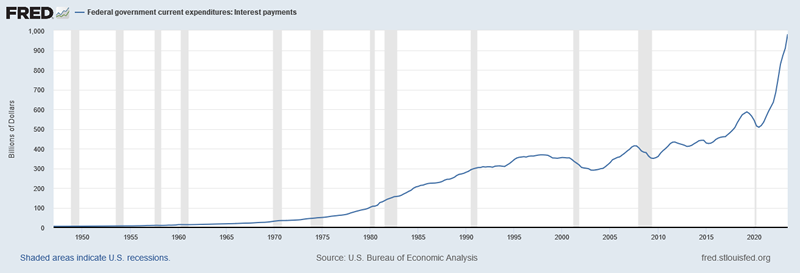
However the primary solution the deficit money printing is to monetize the debt to artificially drive long interests down else risk a bond market collapse due to the weight of debt issuance. However the price paid for this is INFLATION as this graph illustrates that there is no end in sight, it's not just for this decade but literally forever! Net Interest Out lays are on the verge of exceeding the primary deficit for consumption and then it just keeps increasing with each passing year all the way to 30 years from now when it is projected to be 6.7% of GDP, twice that of the primary deficit resulting in a runaway debt mountain as the debt to GDP chart illustrates.
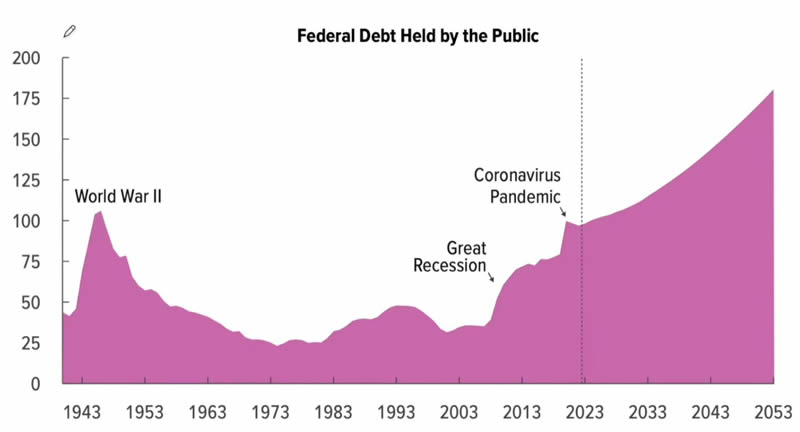
And remember this is the UBO projecting debt to GDP rising to 175%, going parabolic, actual reality will be far worse, OVER 200% of GDP. The devaluation of fiat currencies is going to be on EPIC scale, what we have seen so far this decade and yet to see is going to be a mere fraction of what's to come given that debt issuance is out of control. This is what happens when nations debt mountains pass 100% of GDP, interest payments start going parabolic and along with it the debt mountain as new debt needs to be issued to pay the interest on existing debt as the CBO itself projects interest payments rising to 23% of spending from current 10%, pure money printing.
So the last thing you want to be invested in is in CASH or cash like assets such as T-Bills and Bonds, yes there is the QE game that central banks can play to drive interest rates lower but that only works for short-term while before inflation takes off prompting rate hikes to prevent hyperinflation and hence interest rates over the long run should be heading higher, however by how much and when depends on inflation for which I expect waves of inflation over the whole of this decade, which is in fact a STEALTH TAX on workers not just in America but by virtue of the world being a part of the US financial system every worker on the planet has to be not only subject to the inflation stealth tax of their own government but also to the US via myriad of interlinked mechanism such as the Eurodollar market and that western governments and central banks at least play follow the Fed leader, for instance UK rate decisions take place the day after the Fed's so that the Bank of England keeps in step with it's master.
This analysis is an excerpt from my in-depth analysis and concluding S&P detailed trend forecast for 2024 - S&P Stock Market Analysis, Detailed Trend Forecast Jan to Dec 2024 has first been made available to patrons who support my So for immediate first access to ALL of my analysis and trend forecasts then do consider becoming a Patron by supporting my work for just $5 per month, this is your last chance to lock it in now at $5 before it soon rises to $7 per month for new sign-ups. https://www.patreon.com/Nadeem_Walayat.
QE4EVER
Not to forget the inflation mega-trend courtesy of rampant central bank money printing to monetize government debt coupled with the fake inflation indices where up until recently the Fed had succeeded in hoodwinking the masses that US inflation was just 1%. Instead at that time I warned it was more like 4%! Now it's more like 7%. Anyway the money printing binge now totals $8.8 trillion, up from $4 trillion at the start of 2020 and down from a a peak of $9.62 trillion in the so called Taper. We saw how the taper of 2019 went which at the time I warned would eventually resolve in the Fed Balance sheet DOUBLING. of course I was not expecting it to happen the very NEXT YEAR in 2020!
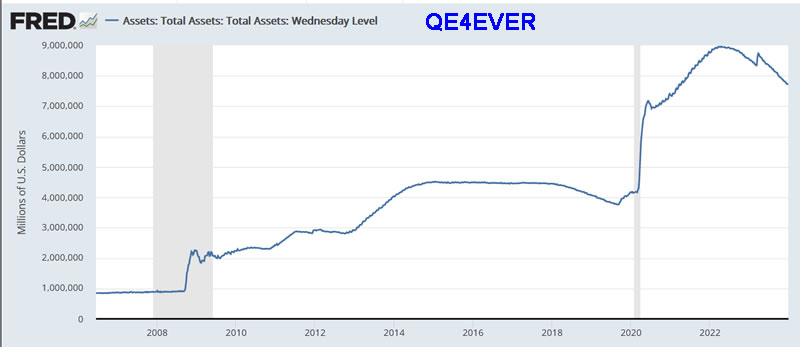
As I wrote 15 ,months ago - "The bottom line is tapering is a temporary smoke and mirrors exercise that ultimately will resolve in a DOUBLING of the Fed balance sheet, that's right in the not too distant future I will be posting a chart of the Fed Balance sheet north of $16 trillion! CRACKUP BOOM HERE WE COME!"
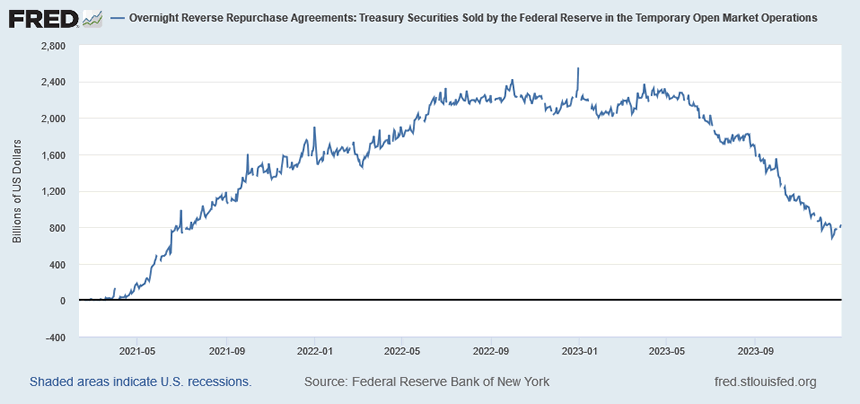
Quantitative Tightening WAS a smoke and mirrors con trick that the lemmings swallowed, there has been NO QT! The $ 1.2 trillion of QT, that the fools in the MSM have focused upon was more then OFSET via a myriad of mechanisms foremost of which is the Reverse Repo Market that the Fed engineered to balloon to $2.6 trillion through interest rates manipulation that during 2023 drained by $1.7 trillion to finance US treasury bond purchases and so abracadabra QT of $1.2 trillion actually turned out to be net QE of at least $500 billion!
What does this mean for the stock and bond markets?
It means there is another $800 million of buying to come to US bonds which will continue to put upwards pressure on bond and stock prices well into 2024, probably into April 2024, and unless by that time there is fresh QE,the bond and stock markets could be primed for a fairly deep correction, which chimes with my existing view for a rally into April 2024. So we could see a case of Sell in April and Go Away rather than Sell in May.
So the reverse repo chart is definitely one to keep an eye on during the year.US Stock Market Addicted to Deficit Spending
What to know what tends to drive the stock market into the stratosphere? US Deficit Spending! (actually twin deficits including Trade), US deficit spending remains out of control, where each peak soon gets passed in a few years time.
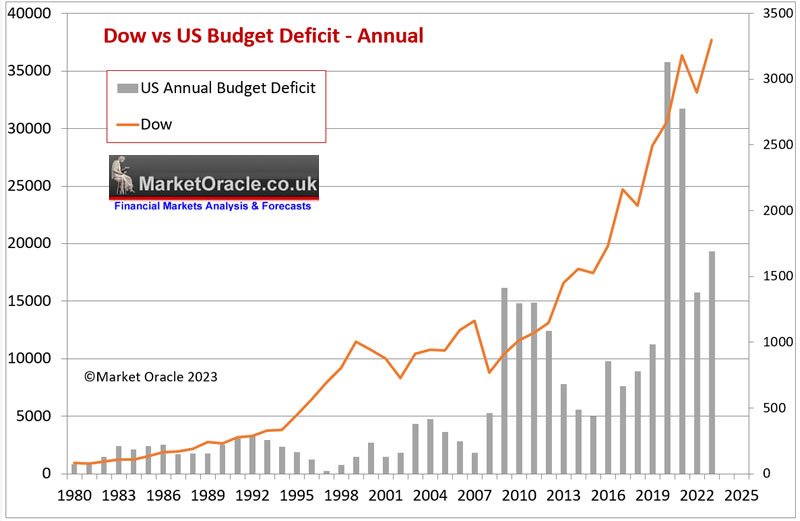
Here's the Dow divided by the annual US budget deficit. Usually the lower the reading the better the prospects for the stock market because stocks are being fuelled by rampant money printing deficit spending that gets monetized by the central bank on an epic scale, all whilst MSM focus on smoke and mirrors.
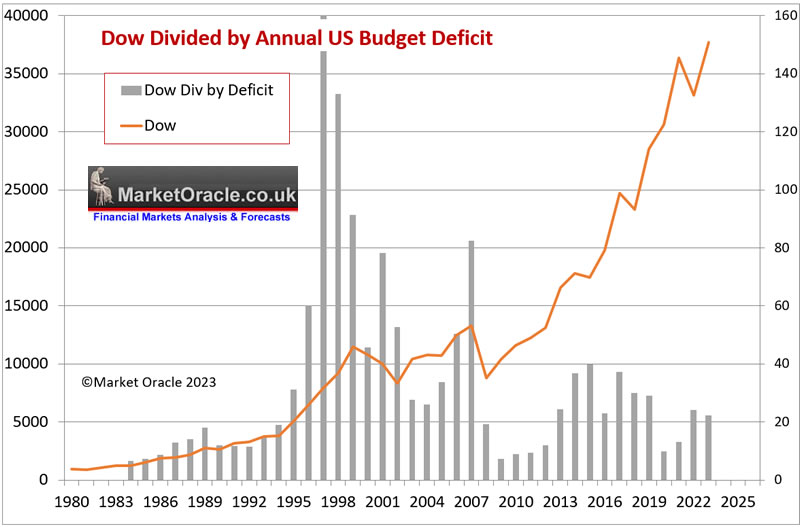
The smaller the bars the more the US government is pumping into the economy and stocks. As you can see that despite all of the noise out of Washington of the Government attempting to reign in the budget deficit the reality is that the US literally continues to inflate stock prices because most of the spending that's going on is for consumption and NOT investment, or for one offs such as on wars, so deficit spending CANNOT STOP without triggering severe economic contraction!
What's the price for rampant money printing?
INFLATION!
This article is an excerpt from my in-depth analysis and concluding S&P detailed trend forecast for 2024 - S&P Stock Market Analysis, Detailed Trend Forecast Jan to Dec 2024 has first been made available to patrons who support my So for immediate first access to ALL of my analysis and trend forecasts then do consider becoming a Patron by supporting my work for just $5 per month, this is your last chance to lock it in now at $5 before it soon rises to $7 for new sign-ups. https://www.patreon.com/Nadeem_Walayat.
Analysis that seeks to replicate the accuracy of 2023:
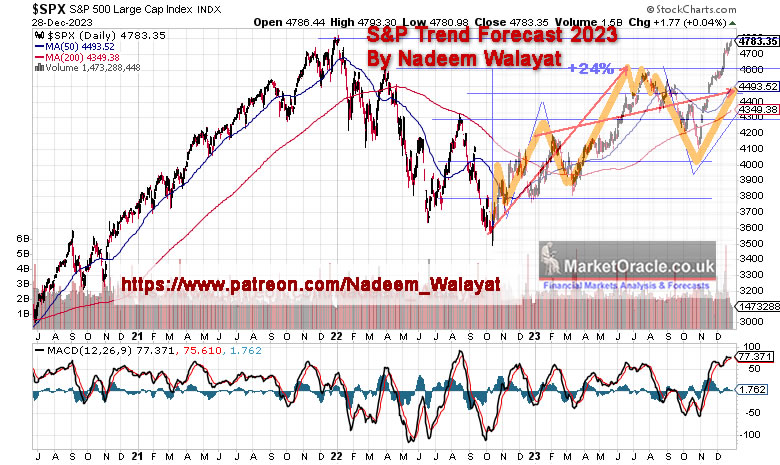
S&P Stock Market Analysis, Detailed Trend Forecast Jan to Dec 2024
CONTENTS
Investing in the Stock Market is Like Boxing With Mike Tyson
Keep Calm and Carry on Buying Quantum AI Tech Stocks
Synthetic Intelligence
The Roaring AI 2020's
Stock Market 2023 Trend Forecast Review
STOCK MARKET DISCOUNTING EVENTS BIG PICTURE
Major Market lows by Calendar Month
US Exponential Budget Deficit
QE4EVER
US Stock Market Addicted to Deficit Spending
INFLATION and the Stock Market Trend
US Unemployment is a Fake Statistic
S&P Real Earnings Yield
S&P EGF EPS Growth
When WIll the Fed Pivot
Stocks and Inverted Yield Curve
The Bond Trade and Interest Rates
US Dollar Trend 2024
US Recession Already Happened in 2022!
US Presidential Election Cycle and Recessions
Margin Debt
Stock Market Breadth
Stock Market Investor Sentiment
Bitcoin S&P Pattern
SP Long-term Trend Analysis
Dow Annual Percent Change
Stock Market Volatility (VIX)
S&P SEASONAL ANALYSIS
Correlating Seasonal Swings
Presidential Election Cycle Seasonal
Best Time of Year to Invest in Stocks
Formulating a Stock Market Trend Forecast
S&P Stock Market Trend Forecast Jan to Dec 2024
Quantum AI Tech Stocks Portfolio
Primary AI Stocks
AI - Secondary Stocks
TESLA
Latest analysis - Stock Market Election Year Five Nights at Freddy's
My counter to the headless chickens following the failure of santa clause rally and the first five trading days indicator.
And gain access to my exclusive to patron's only content such as the How to Really Get Rich series.
Change the Way You THINK! How to Really Get RICH - Part 1

Part 2 was HUGE! >
Learn to Use the FORCE! How to Really Get Rich Part 2 of 3

Part 3 Is Huger! And Gets the Job Done! >
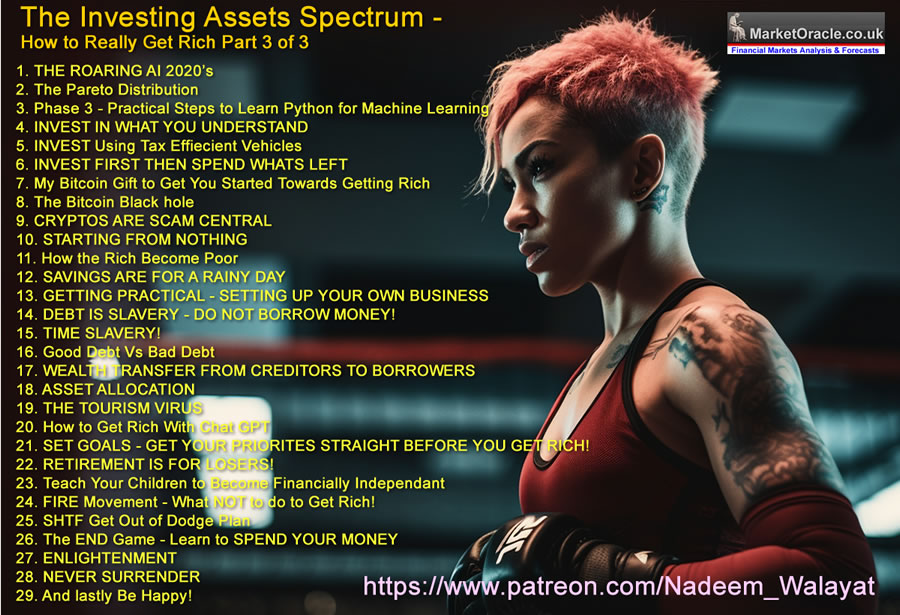
Here's what you get access to for just $5 per month -
※ Patrons Get FIRST access to all of my In-depth analysis and high probability Trend Forecasts, usually 2 full months before the rest of the world. Notified by Patreon by email as well as posted on this page and I will also send a short message in case the extensive email does not make it to your inbox.
※Access to my carefully constructed and maintained AI Tech Stocks Portfolio that is updated on an ongoing basis, that includes on going commentary and a comprehensive spreadsheet that features unique innovations such as the remarkably useful EGF's.
※A concise to the point Investing Guide that explains my key strategies and rules
※ Regular content on How to Trade & Invest incorporated into most articles so as to keep patrons eyes on the big picture and net get too sucked into the noise of price swings.
※ Access to my comprehensive How to Really Get Rich series of articles, clear concise steps that I will seek to update annually and may also eventually form a Patrons only ebook.
※ Access to conclusions from my ongoing market studies from a total of over 200 conducted studies over the decades. updated whenever the market poses a question to be answered. Also enjoy the fruits of R&D into machine learning such as the CI18 Crash indicator that correctly called both the pandemic crash (Feb 2020) and the 2022 bear market (Dec 2021) well before the fact.
※Join our community where I reply to comments and engage with patrons in discussions.
※ I will also keep my Patrons informed of what I am currently working on each month.
※ Influence over my analysis schedule.
My objective is to provide on average 2 pieces of in-depth analysis per month and regular interim pieces of analysis as market briefs. So over a 12 month period expect to receive at least 24 pieces of in-depth analysis. Though my focus is on providing quality over quantity as you can see from the extent and depth of my analysis which I deem necessary so as to arrive at that which is the most probable market outcome.
So for immediate access to all my analysis and trend forecasts do consider becoming a Patron by supporting my work for just $5 per month. https://www.patreon.com/Nadeem_Walayat lock it in before it rises to $7 per month for new signup's this month, so your last chance!
And ensure you are subscribed to my ALWAYS FREE newsletter for my next in-depth analysis.
Your analyst locked and loaded for another bull year.
By Nadeem Walayat
Copyright © 2005-2023 Marketoracle.co.uk (Market Oracle Ltd). All rights reserved.
Nadeem Walayat has over 35 years experience of trading derivatives, portfolio management and analysing the financial markets, including one of few who both anticipated and Beat the 1987 Crash. Nadeem's forward looking analysis focuses on UK inflation, economy, interest rates and housing market. He is the author of five ebook's in the The Inflation Mega-Trend and Stocks Stealth Bull Market series that can be downloaded for Free.


 Nadeem is the Editor of The Market Oracle, a FREE Daily Financial Markets Analysis & Forecasting online publication that presents in-depth analysis from over 1000 experienced analysts on a range of views of the probable direction of the financial markets, thus enabling our readers to arrive at an informed opinion on future market direction. http://www.marketoracle.co.uk
Disclaimer: The above is a matter of opinion provided for general information purposes only and is not intended as investment advice. Information and analysis above are derived from sources and utilising methods believed to be reliable, but we cannot accept responsibility for any trading losses you may incur as a result of this analysis. Individuals should consult with their personal financial advisors before engaging in any trading activities.
Nadeem Walayat Archive |
© 2005-2022 http://www.MarketOracle.co.uk - The Market Oracle is a FREE Daily Financial Markets Analysis & Forecasting online publication.