


What are Leadership Stocks Telling Stock Market Investors
Stock-Markets / US Stock Markets Nov 11, 2008 - 10:53 AM GMTBy: Marty_Chenard

The inside story of what Leadership stocks have been telling investors ...
On November 6th., we posted an in depth study and explanation of the Leadership Stock Ratio . See this link for the study and explanation: Leadership stock Ratio explained . This morning, we will look at a little different twist on the Leadership Stock Ratio .
Instead of calculating the Ratio, what if we calculated the difference between the Very Strong to Very Weak daily number of stocks? What would that show?
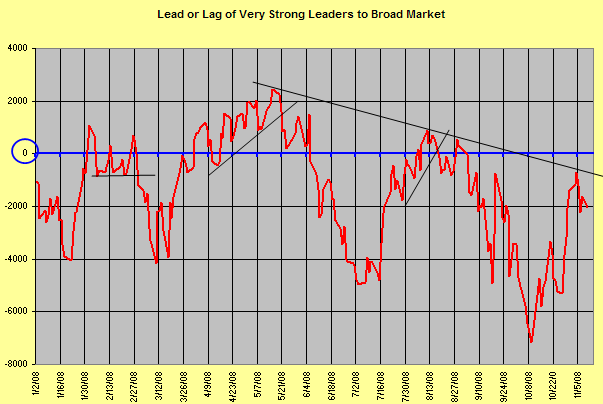
It would show "the change of balance fight" between how many stocks were shifting between being Very Strong in Strength, or Very Weak in Strength as seen in today's chart.
The chart tell's quite a story.
From the end of March to the end of May, the Lead of the Very Strong stocks was in positive territory and trending up. On May 22nd., the trend line was broken to the downside, and the market corrected until the middle of July.
Coincidently, the Lead/Lag chart turned up on July 17th. ... which was also the beginning of the market's up move that lasted until the end of August. But, the market's up move was sickly with the market moving sideways.
Is it any wonder why it only went sideways? Take a look at the July to August time period on the chart below. What do you notice? The Lead/Lag indicator was negative half the time and positive half of the time ... a stalemate. And, the indicator did not get very high in positive territory ... in fact, it made a higher/low signifying that a down trend was in play relative to Very Strong stocks being able to outnumber Very Weak stocks.
So, where are we now?
The Lead/Lag Indicator of the Very Strong stocks minus the number of Very Weak Stocks just moved up close to its resistance line (which is still in negative territory). When it got close, it pulled back and moved lower. It is very probable that it will make another try at moving up to the resistance line to test it in the coming days.
The warning for investors will be if the Lead/Lag indicator does not make it above the resistance line, AND make it above the zero line to move into positive territory.
Please note: Many of you know my wife Cindy. She is a key support in all the work we do at StockTiming.com. Tomorrow is her Birthday ... If you have the chance, I would love it if you could send her a quick email wishing her a Happy Birthday.
Her email address is: stocktimingcindy@yahoo.com ... Many thanks, Marty.
____________________________________________________________________
*** Feel free to share this page with others by using the "Send this Page to a Friend" link below.
By Marty Chenard
http://www.stocktiming.com/
Please Note: We do not issue Buy or Sell timing recommendations on these Free daily update pages . I hope you understand, that in fairness, our Buy/Sell recommendations and advanced market Models are only available to our paid subscribers on a password required basis. Membership information
Marty Chenard is the Author and Teacher of two Seminar Courses on "Advanced Technical Analysis Investing", Mr. Chenard has been investing for over 30 years. In 2001 when the NASDAQ dropped 24.5%, his personal investment performance for the year was a gain of 57.428%. He is an Advanced Stock Market Technical Analyst that has developed his own proprietary analytical tools. As a result, he was out of the market two weeks before the 1987 Crash in the most recent Bear Market he faxed his Members in March 2000 telling them all to SELL. He is an advanced technical analyst and not an investment advisor, nor a securities broker.
Marty Chenard Archive |
© 2005-2022 http://www.MarketOracle.co.uk - The Market Oracle is a FREE Daily Financial Markets Analysis & Forecasting online publication.