


Stock Market Internals Point to Continuing Base Building into 2009
Stock-Markets / Global Stock Markets Dec 31, 2008 - 05:53 AM GMT

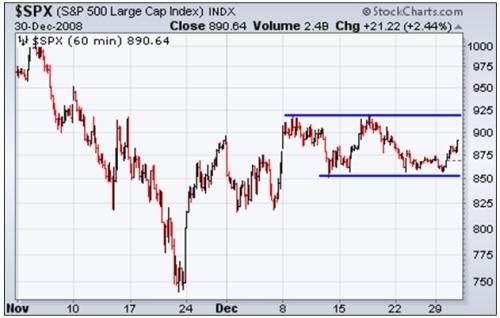
 As investors ring out the old year, trading volume should remain light until battle-weary traders return from the holidays next week. Not much weight should therefore be placed on market movements during this “thin” period, and the S&P 500 Index will probably not deviate a great deal from its three-week trading range.
Ushering in the new year, investors will not only be hung over from 2008's financial rout, but also still be grappling with the vital question: What is the most likely direction of the stock market?
I have analyzed a number of fundamental and technical considerations in my recent posts (“ Stock Markets: Is this It? ”, “ Is the Tide Turning for Stocks? ” and “ Is the Stock Market Rally Real? ”). Additionally, breadth indicators are also useful tools to assess the inner workings of the market's rallies or corrections, and are discussed in this article. These indicators are used to identify strength or weakness behind market moves such as the rally since late-November, i.e. to assess how the bulls and the bears are exerting themselves.
First, a quick review of the stock market scoreboard. The MSCI World Index and the MSCI Emerging Markets Index have improved by 18.7% and 21.9% respectively since the November 20 lows. As far as the US markets are concerned, the Dow Jones Industrial Index has gained 14.8% since the low, the S&P 500 Index 18.4%, the Nasdaq Composite Index 17.8% and the Russell 2000 Index 25.3%.
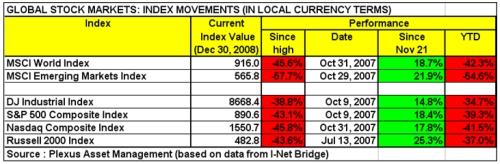
Although the MSCI Emerging Markets Index and the Russell 2000 Index now qualify as being in new bull markets (at least in terms of the traditional definition of a 20% rise), all indices still have an exceedingly long road ahead to regain the start-of-year and top-of-bull-market levels.
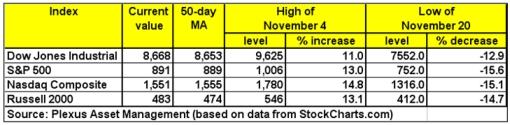
The table below shows the key resistance and support levels for the major US indices. After having flirted with their respective 50-day moving averages earlier in December, all the indices are again at these resistance levels. The next targets are the November 4 highs, followed by the key 200-day average (not shown on table). On the downside, the December 1 (not shown) and all-important November 20 lows must hold for the uptrend to remain intact.
Let's consider six measures of stock market “internals”.
(1) The advance/decline spread tracks the difference between advancing and declining issues and is widely used to measure the breadth of a stock market advance or decline. The chart below shows that the spread between declining and advancing issues on the NYSE has been moving in the right direction (for bulls) since the November lows and is actually again in positive territory.
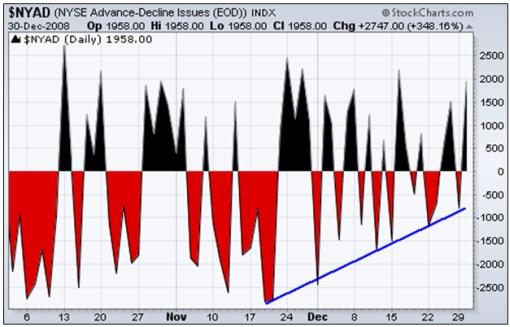
(2) The up/down volume spread is determined by subtracting the volume of declining issues from the volume of advancing issues. The chart is similar in appearance to the one above and the conclusion is the same.
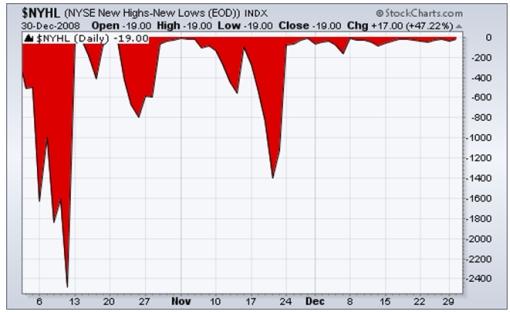
(3) Net new highs are calculated by subtracting the number of new 52-week lows from the number of new 52-week highs. The panic day of October 10 marked an “internal bottom” when 92.6% of the stocks on the NYSE broke to new lows (whereas a “price bottom” was recorded on November 20). Net new highs have since improved markedly, but new lows are still in excess of new highs.
(4) Turning to Lowry Research , its Selling Pressure Index (supply) has been steadily declining, but the Buying Power Index (demand) has not made headway as potential buyers remain unnerved and stick to the sidelines. “Normally, at final bear market bottoms, the Buying Power Index will plow higher as institutional money rushes in to pick up ‘bargains',” said the 84-year-old Richard Russell ( Dow Theory Letters ).
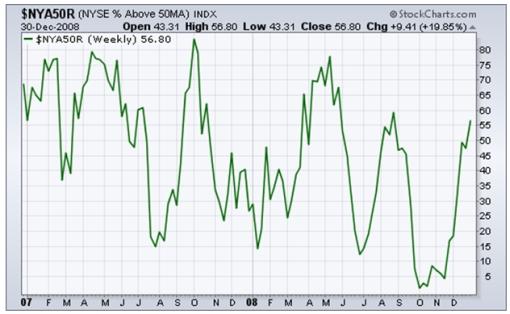
(5) The number of NYSE stocks trading above their respective 50-day moving averages has increased to 56.8% from almost zero in October. In order to be bullish about the secondary trend, one would expect the majority of stocks to be above the 50-day line. For a primary uptrend to manifest itself, the bulk of the index constituents also need to trade above their 200-day averages. This is a slow indicator, but the number at the moment is still a non-existent 8.0%.
(6) The Bullish Percent Index shows the percentage of stocks that are currently in bullish mode as a result of point-and-figure buy signals. With the figure at 52.3%, this indicator conveys the same message as the previous one.
Although stock market breadth has been moving in the right direction since October/November, the “internals” need to make further headway – advancing issues eclipsing declining issues, up volume outstripping down volume, new highs outpacing new lows and a higher percentage of stocks entering a bull phase – in order for an overall bull market to get traction.
It is too early to say whether the declines have been completed and the rally is sustainable. Failing stronger internals and further evidence of the thawing of the credit markets and the world's financial systems starting to function normal again, investor confidence will probably remain reticent (with $8.85 trillion staying on the sidelines in cash, bank deposits and money market funds).
However, one should be cognizant of the fact that while the financial news continues to be awful, the stock market lows are holding and bases are forming. Selective buying – companies and sectors – in global markets is in order, and '09 may turn out to be a good year for a discerning stock picker. However, make sure to separate the wheat from the chaff because many companies will fall by the wayside during the new year.
Did you enjoy this post? If so, click here to subscribe to updates to Investment Postcards from Cape Town by e-mail.
By Dr Prieur du Plessis
Dr Prieur du Plessis is an investment professional with 25 years' experience in investment research and portfolio management.
More than 1200 of his articles on investment-related topics have been published in various regular newspaper, journal and Internet columns (including his blog, Investment Postcards from Cape Town : www.investmentpostcards.com ). He has also published a book, Financial Basics: Investment.
Prieur is chairman and principal shareholder of South African-based Plexus Asset Management , which he founded in 1995. The group conducts investment management, investment consulting, private equity and real estate activities in South Africa and other African countries.
Plexus is the South African partner of John Mauldin , Dallas-based author of the popular Thoughts from the Frontline newsletter, and also has an exclusive licensing agreement with California-based Research Affiliates for managing and distributing its enhanced Fundamental Index™ methodology in the Pan-African area.
Prieur is 53 years old and live with his wife, television producer and presenter Isabel Verwey, and two children in Cape Town , South Africa . His leisure activities include long-distance running, traveling, reading and motor-cycling.
Copyright © 2008 by Prieur du Plessis - All rights reserved.
Disclaimer: The above is a matter of opinion and is not intended as investment advice. Information and analysis above are derived from sources and utilizing methods believed reliable, but we cannot accept responsibility for any trading losses you may incur as a result of this analysis. Do your own due diligence.
Prieur du Plessis Archive |
© 2005-2022 http://www.MarketOracle.co.uk - The Market Oracle is a FREE Daily Financial Markets Analysis & Forecasting online publication.