


Gold Bearish Double Top Pattern?
Commodities / Gold & Silver 2009 Feb 23, 2009 - 03:46 AM GMTBy: Roland_Watson

 The following is taken from our regular weekend update to subscribers. The main question for precious metals investors this week is whether gold is about to form a massive double top. If we pull up the gold chart we have shown on several occasions, we see gold is just about to meet the upper channel line we have suggested it will be bounded by. And guess what? It meets the old NYMEX high of March 17th this week coming. Can anyone say " double top "? The last time gold hit $1000 (March 16th) it peaked the next day and the rest was history.
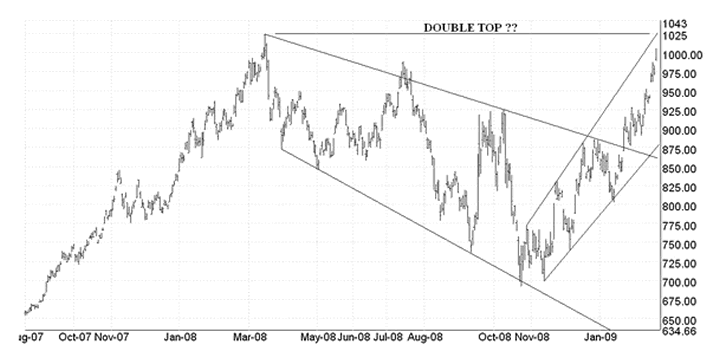
I do not intend to sell any gold holdings tomorrow since I am in it for the longer run but the chart is warning of a break down to the lower channel line of $875 - at least. You can be sure silver will follow if gold breaks down here.
When gold hit $1000 for the first time ever on Friday March 14th 2008, silver hit a high of $20.88 but now it can only muster about $14.50 when gold breached $1000 again. Why the dismal performance? The answer is because silver is a more recession sensitive metal compared to gold and decrease in industrial demand is acting as a dampener on the silver price. As said before, when the unemployment figures peak then and only then does silver become a multi-year buy. What is going on just now is a trader's market.
Our strikes rule is still in place as silver skirts just above its own upper channel line. We simply await the breakdown of this multi month rally.
The stock markets are now breaking below their November lows and we expect a new descent to ultimate lows perhaps in June. In terms of probabilities that will pan out as an Elliott impulse wave though we must be wary of a possible ending diagonal formation as well. Expect the buying opportunity of a generation when this bottom hits!
As an addendum to that weekend update, one can see that we foresee no Great Depression II here though one will certainly follow in a decade or more. But once the bottom hits for general equities we foresee another multi-year bull market going into the 2020s at most though the force and vigour of it will not be as great as the 1980-2000 bull which was in a class of its own.
Further analysis of silver can be had by going to our silver blog at http://silveranalyst.blogspot.com where readers can obtain a free issue of The Silver Analyst and learn about subscription details. Comments and questions are also invited via email to silveranalysis@yahoo.co.uk .
By Roland Watson
http://silveranalyst.blogspot.com
Further analysis of the SLI indicator and more can be obtained by going to our silver blog at http://silveranalyst.blogspot.com where readers can obtain the first issue of The Silver Analyst free and learn about subscription details. Comments and questions are also invited via email to silveranalysis@yahoo.co.uk .
Roland Watson Archive |
© 2005-2022 http://www.MarketOracle.co.uk - The Market Oracle is a FREE Daily Financial Markets Analysis & Forecasting online publication.