


What Does the Bottom of a Bear Market Look Like?
Stock-Markets / Stocks Bear Market Apr 02, 2009 - 01:52 PM GMTBy: Marty_Chenard

 Today, we posted our second study on "How a Bear Market ends".
The first was a study of what the Institutional Investors did relative to "Accumulation" and the end of the 2002-2003 Bear Market.
We just published a second study that looks at the 2002-2003 and the current behavior of the market.
Below is a study of the 2001 to 2003 time period where the last Bull Market finally bottomed out and entered a new Bull Market.
The focus of this particular study is to observe "what a bottoming process" looks like in terms of "market strength" and "market lows".
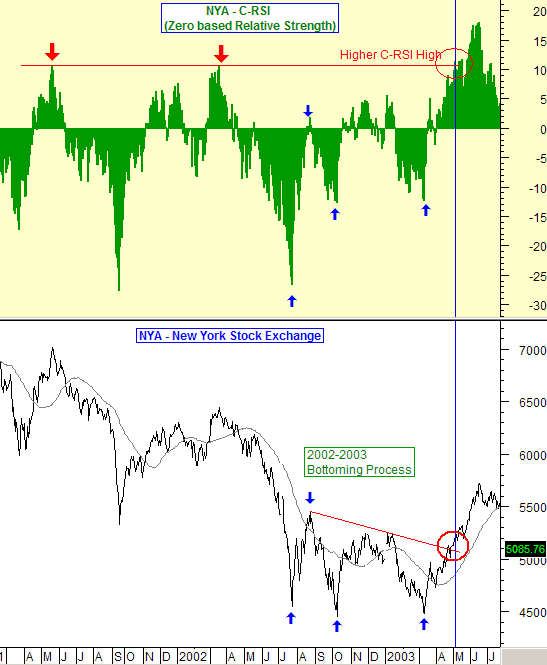
Let's first focus on the NYA price chart below. Notice that the NYA Index made a low, followed by a lower/low ... see the blue arrows.
After that, the NYA initiated a RETEST OF THE LOWS before the final bottom could set in. *We are now at the point of a rise after this market's second low which was also a lower/low. (The transition to a Bull Market did NOT occur until after a retest of the lows, AND an upside break of the Bear Market's resistance line.)
With that NYA Index observance in place, let us next look at our C-RSI behavior during the 2002-2003 Bean Market end.
Note the red arrows and how that created a C-RSI resistance during the Bear Market (the C-RSI is our zero-based Relative Strength Indicator).
During the bottoming process of the last Bear Market, the Bear did not die until the NYA's resistance was broken to the upside WITH the C-RSI subsequently breaking above the Bear Market resistance line in red. That was the confirmation that the market had "the strength" to continue what the break out of the NYA's resistance line had started.
If fairness to our paid subscribers, we won't post the whole study, but ... we will say that that the above criteria for "a Bear Market end" has not been met yet.
________________________________________________
*** Feel free to share this page with others by using the "Send this Page to a Friend" link below.
By Marty Chenard
http://www.stocktiming.com/
Please Note: We do not issue Buy or Sell timing recommendations on these Free daily update pages . I hope you understand, that in fairness, our Buy/Sell recommendations and advanced market Models are only available to our paid subscribers on a password required basis. Membership information
Marty Chenard is the Author and Teacher of two Seminar Courses on "Advanced Technical Analysis Investing", Mr. Chenard has been investing for over 30 years. In 2001 when the NASDAQ dropped 24.5%, his personal investment performance for the year was a gain of 57.428%. He is an Advanced Stock Market Technical Analyst that has developed his own proprietary analytical tools. As a result, he was out of the market two weeks before the 1987 Crash in the most recent Bear Market he faxed his Members in March 2000 telling them all to SELL. He is an advanced technical analyst and not an investment advisor, nor a securities broker.
Marty Chenard Archive |
© 2005-2022 http://www.MarketOracle.co.uk - The Market Oracle is a FREE Daily Financial Markets Analysis & Forecasting online publication.