


Stock Market VIX Volatility Still High
Stock-Markets / Volatility May 02, 2009 - 02:14 PM GMTBy: Richard_Shaw

 The VIX (a measure of options volatility, an indicator of stock market volatility risk, and reputedly a “fear gauge”) has come down so far from being historically high, that commentators now speak of it as low. The fact is that is it still high relative to the intermediate past.
The 10-year average VIX is 22. The 6-month average is 41. The current level is 35.
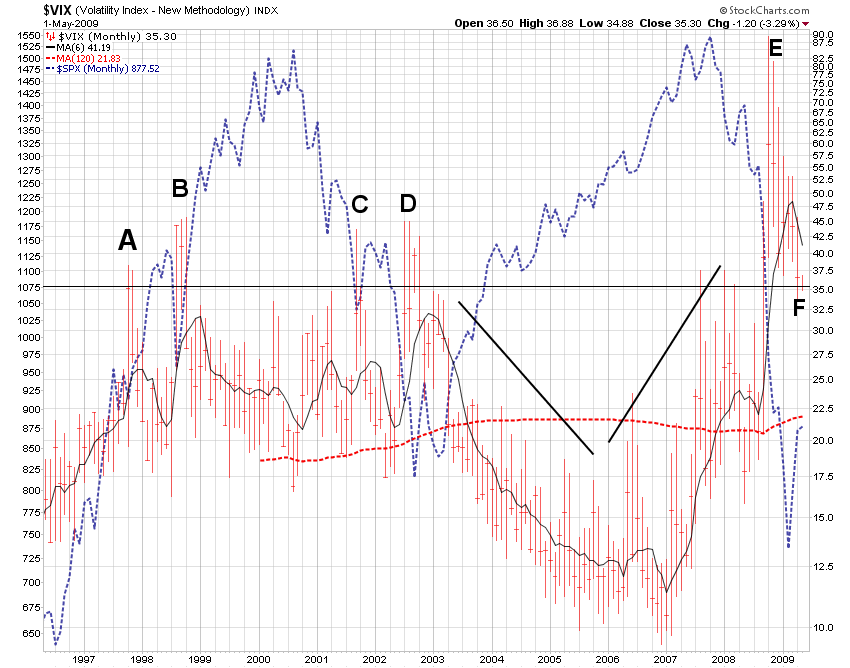
The chart shows the VIX for several troubled times:
- A: Asian currency crisis (1997) - VIX 38
- B: Russian economic crisis (1998) - VIX 46
- C: terrorist attack on New York City (2001) - VIX 44
- D: multiple major US bankruptcies (2002) * - VIX 45
- E: CDO and general credit crisis (2008) - VIX 90
- F: today - VIX 35
* 7 of 15 largest US bankruptcies occurred in 2002 (or Dec 2001): Enron, Global Crossing, Conseco, Worldcom, UAL, NTL, and Adelphia Communications.
Feeling better or worse, is all relative to recent memories. The VIX sure feels better, but not long ago the current level would be considered quite elevated. The low reached in December 2006 was 9 (that was extreme in the other direction).
It is probably no coincidence that an historically low VIX was followed by an historically high VIX. Markets often have a tendency to overshoot and undershoot some central tendency by roughly equal amounts. Pendulums swing the same distance each side of dead center, for example, and markets tend to do the same.
When the VIX dropped ever lower below 20 as the S&P 500 pulled out of its 2003 bottom (VIX reaching low of 9 in December 2006), some commentators were talking of a new low volatility market paradigm. They were wrong. When the VIX peaked at 89 and then dropped to today’s 35 levels, some commentators have talked about a new elevated volatility paradigm. They are probably wrong.
Mean reversion is usually your best bet. Paradigms do shift, and recognizing them when they are real is important, but explaining mean deviation as a new paradigm without persuasive arguments for the shift is an easy discussion path that is more likely than not be be an expensive investment path.
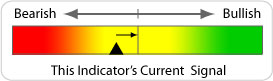
The VIX is high but lower, which means the aggregate market wisdom is that the end-of-the-world economic concerns of Q4 2008 have passed, but substantial doubts remain about a new bull at this time — bearish, but improving.
There are signs that the global economic crisis is moderating, according to central banks and some data. On the other hand the overall economic situation is still in decline and still vulnerable to new shocks. The elevated VIX seems to be reflecting that.
By Richard Shaw
http://www.qvmgroup.com
Richard Shaw leads the QVM team as President of QVM Group. Richard has extensive investment industry experience including serving on the board of directors of two large investment management companies, including Aberdeen Asset Management (listed London Stock Exchange) and as a charter investor and director of Lending Tree ( download short professional profile ). He provides portfolio design and management services to individual and corporate clients. He also edits the QVM investment blog. His writings are generally republished by SeekingAlpha and Reuters and are linked to sites such as Kiplinger and Yahoo Finance and other sites. He is a 1970 graduate of Dartmouth College.
Copyright 2006-2009 by QVM Group LLC All rights reserved.
Disclaimer: The above is a matter of opinion and is not intended as investment advice. Information and analysis above are derived from sources and utilizing methods believed reliable, but we cannot accept responsibility for any trading losses you may incur as a result of this analysis. Do your own due diligence.
Richard Shaw Archive |
© 2005-2022 http://www.MarketOracle.co.uk - The Market Oracle is a FREE Daily Financial Markets Analysis & Forecasting online publication.