It Takes Bulls to Make a Stocks Bull Market
Stock-Markets /
Articles
May 10, 2009 - 07:44 PM GMT
By: Guy_Lerner


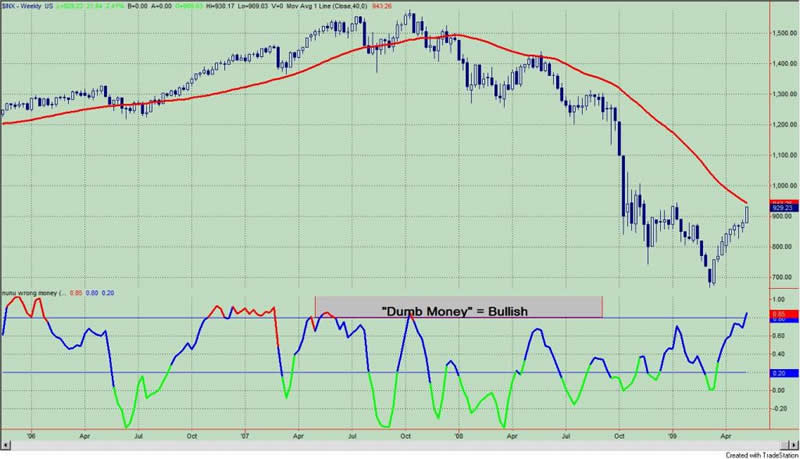
The "Dumb Money" indicator now shows that there are too many bulls. From a contrarian perspective, one would think that this is bearish for prices as there are too many believers in what pundits are calling the next bull market - "hey you, your missing the train... your missing a generational buying opportunity". But in reality, it takes bulls to make a bull market. So higher prices and excessive bullish sentiment have occurred together in the past, and this dynamic is generally the norm in a bull market as the data shows. On the other hand, the bulls - or newly bullish let's say - should be careful what they wish for as excessive bullish sentiment can also herald an intermediate term top in a bear market.
The "dumb money" looks for extremes in the data from 4 different groups of investors who historically have been wrong on the market: 1) Investor Intelligence; 2) Market Vane; 3) American Association of Individual Investors; and 4) the put call ratio. See figure 1.
Figure 1. "Dumb Money"/ weekly
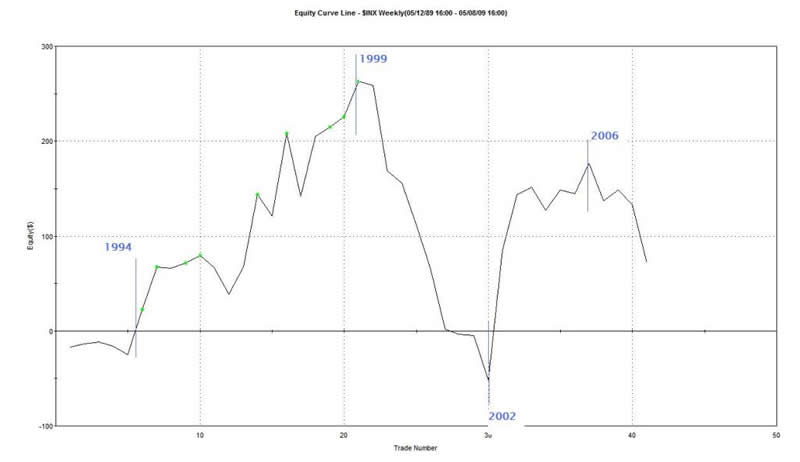
To provide some context as to the significance of too many bulls, let's construct a study. We will "buy" the SP500 when the "Dumb Money" indicator shows that there are too many bulls and we will sell when this condition is relieved. In other words, we are only in the market when the indicator is red and above the upper line. Commissions and slippage are not considered.
Since 1990, such a strategy has yielded 41 unique signals or trades. 46% of the signals were winners, and this strategy generated a paltry 72 S&P500 points; buy and hold over this time period has yielded 570 S&P500 points. Your time in the market was 23%. If this was the only strategy you traded since 1991, you would have an equity curve that looked like the one in figure 2.
Figure 2. Equity Curve/ "too many bulls"
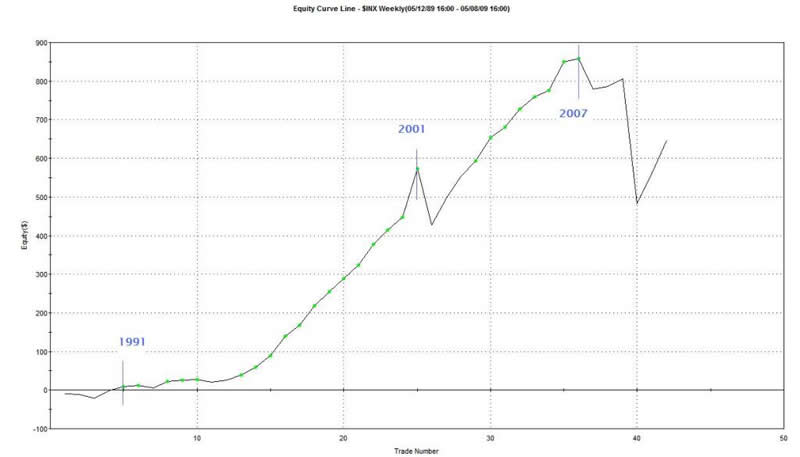
Now let's put the notion of excessive bullish sentiment aside for a moment and go back in time about 10 weeks when there were too many bears. Let's construct another strategy where we "buy" the S&P500 only during the time when the "Dumb Money" indicator shows that investor sentiment is too bearish. I previously discussed the significance of excessive bearish sentiment in the March 8, 2009 (note the date) article,
"Putting A Bullish Signal In Context". Since 1990, there have been 42 unique signals or trades; 80% have been profitable. This strategy generated 647 S&P500 points (versus 600 S&P500 points for buy and hold) with only 20% market exposure. The equity curve for this strategy is shown in figure 3.
Figure 3. Equity Curve/ "too many bears"
Comparing the two strategies and equity curves, I will leave it up to you as to what point in the price cycle you want to be invested.
But let's look a bit more closely at our current dynamic - "too many bulls" - and the equity curve in figure 2. From 1994 to 1999, the curve makes a nice 45 degree ascent; this coincides with the end of the 20 year bull market. So, during this time, it was a good idea to buy when everyone was bullish. Remember, it takes bulls to make a bull market. From 1999 to December, 2002, this strategy of buying when there are too many bulls gave back the gains from the 1990's. Then from December, 2002 to December, 2006 the strategy yielded positive results, and since 2006, the strategy has not been too kind to the bulls.
So what is the take away message? Some times it pays to play with the bulls and sometimes it doesn't. Too many bulls is a hallmark of a bull market, and at other times, it is a hallmark of a market top. I guess it all boils down to one simple question: is this a bull market? My current feelings on this topic are stated in
"Bear Market Rally Or New Bull?".
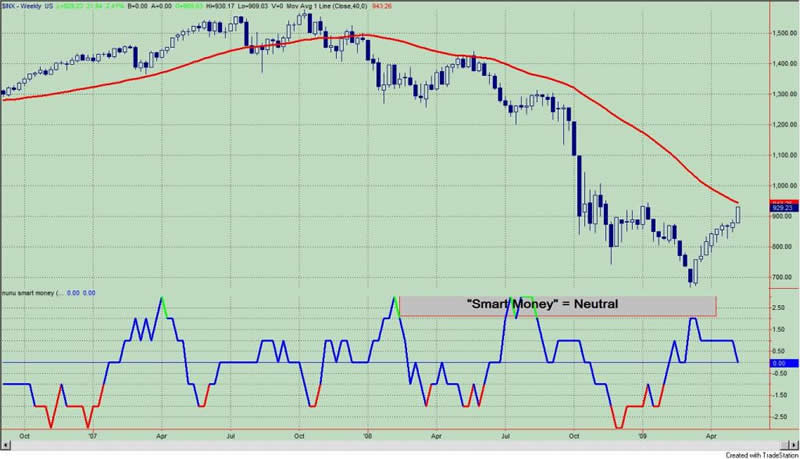
For the record, the "Smart Money" indicator is shown in figure 4. The "smart money" indicator is a composite of the following data: 1) public to specialist short ratio; 2) specialist short to total short ratio; 3) SP100 option traders. The "smart money" is less bullish this week than last.
Figure 4. "Smart Money"/ weekly
By Guy Lerner
http://thetechnicaltakedotcom.blogspot.com/
Guy M. Lerner, MD is the founder of ARL Advisers, LLC and managing partner of ARL Investment Partners, L.P. Dr. Lerner utilizes a research driven approach to determine those factors which lead to sustainable moves in the markets. He has developed many proprietary tools and trading models in his quest to outperform. Over the past four years, Lerner has shared his innovative approach with the readers of RealMoney.com and TheStreet.com as a featured columnist. He has been a regular guest on the Money Man Radio Show, DEX-TV, routinely published in the some of the most widely-read financial publications and has been a marquee speaker at financial seminars around the world.
© 2009 Copyright Guy Lerner - All Rights Reserved
Disclaimer: The above is a matter of opinion provided for general information purposes only and is not intended as investment advice. Information and analysis above are derived from sources and utilising methods believed to be reliable, but we cannot accept responsibility for any losses you may incur as a result of this analysis. Individuals should consult with their personal financial advisors.
© 2005-2022 http://www.MarketOracle.co.uk - The Market Oracle is a FREE Daily Financial Markets Analysis & Forecasting online publication.