


Very Dangerous Time For Dollar Index
Currencies / US Dollar Jun 20, 2009 - 12:21 AM GMTBy: Guy_Lerner

 I don't want to get into the prediction game or even be the first one to say, "I told you so", but I believe the Dollar Index (symbol: $DXY) has a very high likelihood of embarking on a major down swing in the coming weeks.
I am making this observation based upon a simple chart pattern. See figure 1 a weekly chart of the Dollar Index. This is the same chart that I posted on May 29, 2009 in the commentary, "5 Reasons To Be Bullish On Gold".
Figure 1. $DXY/ weekly
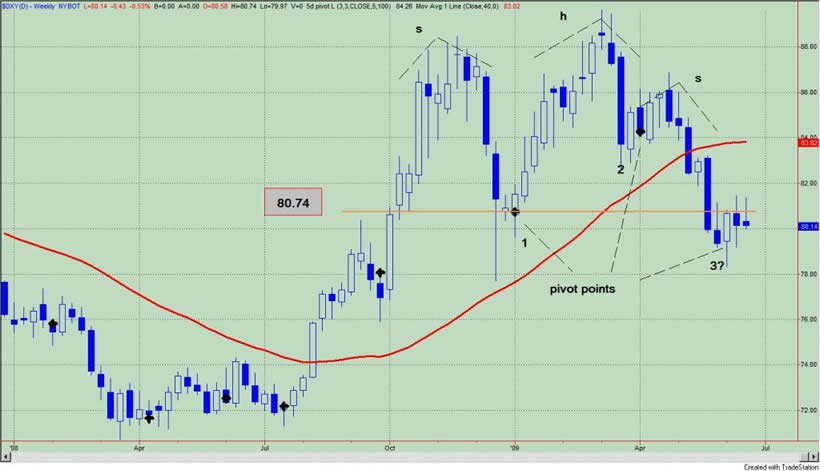
The black dots represent pivot points, and the red line is a simple 40 week moving average. The recent up swing (i.e., last 2-3 weeks) is likely to leave a pivot point on the chart at $79.50. If prices close below this pivot point on a weekly closing basis, then this would represent a close below 3 pivot points, and this is the pattern that I believe would be very ominous for the Dollar Index.
How ominous? Let's ask the following question: what happens to the Dollar Index when prices close below 3 pivot points? To answer this question, we will construct a strategy where we short (i.e., bet against) the Dollar Index when this occurs, and we will cover our positions on any close above the 40 week moving average.
Since 1980, there have been 14 unique instances (or trades) when prices closed below 3 pivot points. While a close below 3 pivot points has merit as a trading strategy, my goal here isn't to develop a strategy, but to warn of the potential down side that such an event can mark. So let's look at each individual trade in this strategy, and you will then understand how low the Dollar can potentially go.
To look at each trade, we will introduce a concept called Maximum Favorable Excursion or MFE. MFE measures in percentage terms how far a trade can go in your favor before it is closed out for a loss or a win. For example, look at the MFE graph from our "close below 3 pivot points strategy" in the Dollar Index. Remember we are shorting the Dollar Index here. See figure 2. The green caret within the blue box represents one trade. This trade ran up about 9% (x-axis) and was closed out for a 2% gain (y-axis). We know this trade was a winner because it is a green caret.
Figure 2. MFE
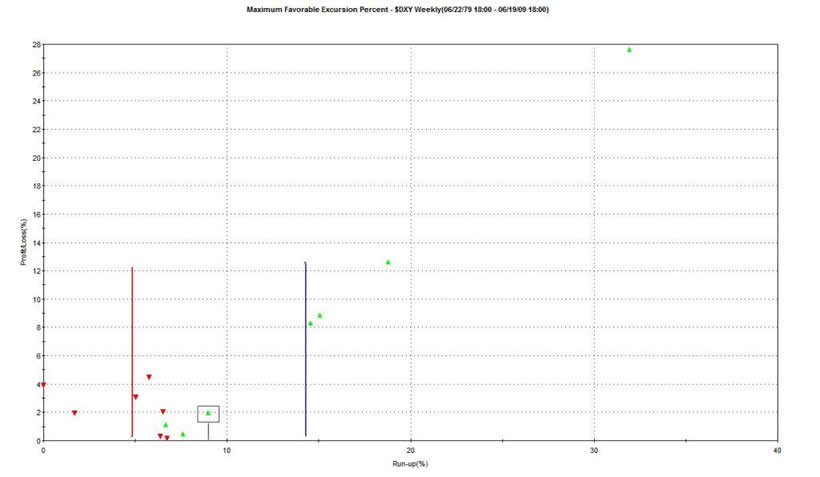
Looking at the graph, we see that 4 of the 14 short trades ran up greater than 14% before being closed out; these are the carets to the right of the blue vertical line. So think about that for a second. You short the Dollar Index based upon this pattern, and you have a 28% chance (4/14) of seeing prices fall significantly.
Taking it one step further, we see that 12 out of the 14 trades had an MFE greater than 5%; this is to the right of the red line. In other words, if there is a close below the 3 pivots, then there is an 85% chance (12/14) that the Dollar Index should fall at least 5%.
So when I state above that "I believe the Dollar Index (symbol: $DXY) has a very high likelihood of embarking on a major down swing in the coming weeks", I am basing this comment on these observations.
By Guy Lerner
http://thetechnicaltakedotcom.blogspot.com/
Guy M. Lerner, MD is the founder of ARL Advisers, LLC and managing partner of ARL Investment Partners, L.P. Dr. Lerner utilizes a research driven approach to determine those factors which lead to sustainable moves in the markets. He has developed many proprietary tools and trading models in his quest to outperform. Over the past four years, Lerner has shared his innovative approach with the readers of RealMoney.com and TheStreet.com as a featured columnist. He has been a regular guest on the Money Man Radio Show, DEX-TV, routinely published in the some of the most widely-read financial publications and has been a marquee speaker at financial seminars around the world.
© 2009 Copyright Guy Lerner - All Rights Reserved
Disclaimer: The above is a matter of opinion provided for general information purposes only and is not intended as investment advice. Information and analysis above are derived from sources and utilising methods believed to be reliable, but we cannot accept responsibility for any losses you may incur as a result of this analysis. Individuals should consult with their personal financial advisors.
Guy Lerner Archive |
© 2005-2022 http://www.MarketOracle.co.uk - The Market Oracle is a FREE Daily Financial Markets Analysis & Forecasting online publication.