Gold Breaks Above $1,000 an Ounce, What’s Next?
Commodities / Gold & Silver 2009 Sep 09, 2009 - 07:49 AM GMTBy: Claus_Vogt
 Yesterday, gold broke the $1,000-an-ounce barrier, after rising from $950 per ounce last week.
It was the precious metal’s fifth run-up to the round number. And now there are many signs indicating that yesterday’s decisive break is of major importance.
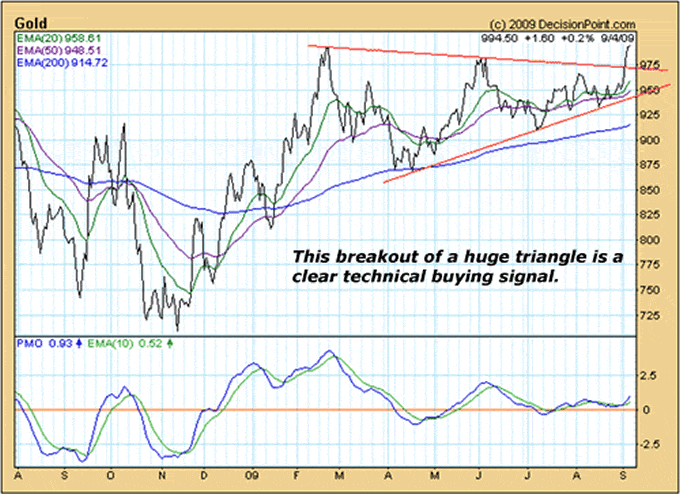
Take a look at the following chart …
As you can see, from November 2008 through February 2009, gold rose from around $700 to nearly $1,000.

The ensuing consolidation took six months … and ended last week. This consolidation has the form of a triangle, which typically confirms a trend.
With last week’s strong breakout above the upper boundary of this triangle, a clear buy signal was generated. And that explains gold’s move above $1,000.
Now, Momentum Indicators and Price Targets Point to More Gains Ahead …
The high momentum of this move is bullish. In spite of this healthy thrust, medium-term momentum indicators are not yet overbought. As you can see in the lower panel of my chart above, the price momentum oscillator (PMO) is still in neutral territory and just starting to turn up. In my opinion, that means there is a lot of room for additional price gains.
Sentiment indicators point in the same direction. Last Thursday, the Hulbert Gold Newsletter Sentiment Index stood at just 25.2 percent, which is a very low reading. During gold’s previous rallies to the $1,000 mark, this sentiment indicator stood at 61.8 percent on average. The high skepticism greeting the current rally is very bullish from a contrarian standpoint.
So how high could gold go from here?
Well, the width of that triangle formation can be used to calculate a minimum price target. It’s around $1,100.
A 10 percent move may not sound too exciting, but it’s just a minimum target. Plus, there is a very important additional message coming with this price target …
A Rise Above the Resistance Is Extremely Bullish
You have to step back a bit and look at a longer-term gold chart to realize the significance of a clear break above the resistance zone around the $1,000 level.
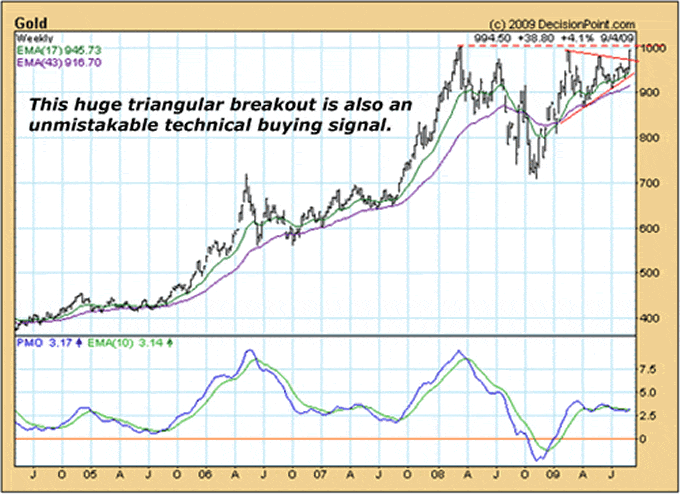
Here’s a weekly chart …

As you can see, gold started a huge consolidation period in March 2008. It reached a low of approximately $700, which is a clear support area. Then it moved back up to the $1,000 level.
This whole movement can be seen as nothing more than a typical correction taking place during a long-term uptrend.
A break above its upper boundary around the $1,000 level signals the end of this huge consolidation and the start of the next medium-term uptrend.
The minimum target of this larger formation amounts to $1,300. And since gold is in a long-term bull market, I see even this area as just an interim target.
Longer term I expect much higher prices. Here are the reasons why:
 |
| Numerous fundamental factors all but guarantee higher gold prices. |
- As a consequence of the current financial and economic crisis government debt is going through the roof — not just in the U.S., but all over the world.
- Worldwide central banks are printing money like there is no tomorrow.
- Gold demand is rising due to rising wealth in emerging economies where the yellow metal is still favored as a store of value.
- Gold supply is stagnating or even slightly shrinking — despite the metal’s price rise since 2001. This is because it’s getting ever more difficult and expensive to get gold out of the earth.
- Finally, central bankers who were very eager to sell government gold at much lower prices a few years ago are getting increasingly reluctant to keep doing so. Emerging market central banks are even buying.
So with this important technical breakout now behind us, and these fundamentals in place, I expect the long-term bull market to continue. Much higher highs are very likely.
Best wishes,
Claus
This investment news is brought to you by Money and Markets . Money and Markets is a free daily investment newsletter from Martin D. Weiss and Weiss Research analysts offering the latest investing news and financial insights for the stock market, including tips and advice on investing in gold, energy and oil. Dr. Weiss is a leader in the fields of investing, interest rates, financial safety and economic forecasting. To view archives or subscribe, visit http://www.moneyandmarkets.com .
Money and Markets Archive |
© 2005-2022 http://www.MarketOracle.co.uk - The Market Oracle is a FREE Daily Financial Markets Analysis & Forecasting online publication.


