


Stock Market Overly Bullish Stance Typical at New Market Starts
Stock-Markets / Stock Index Trading Oct 12, 2009 - 03:50 AM GMTBy: Donald_W_Dony

 The four markets; currencies, bonds, commodities and stocks, are continuing to respond in an arena of mixed emotions. Bond prices have firm support from traders fearing deflationary pressures are coming and also a longer-term stock market correction. Gold bugs are on the other side. They are convinced that rapid inflationary concerns are developing due to the steady deterioration of the US Dollar.
The precious metal, in response, recently printed new all-time highs north of $1050 per ounce. Currency traders, who once supported the $USD as a flight-to-safety play, are presently shunning the greenback for worry of prolonged devaluation and are moving toward natural resource-driven currencies. These economies (Australia, Canada and Brazil) are viewed as the first countries to start raising their interest rates.
However, for most investors, it is the actions of the stock market that is of prime interest. Valuations (P/E multiples), which are normally not the best timing gauge, remain in the overvalued levels at trailing earnings of 27x. The historic average is closer to 16x. Stocks have forged ahead, since early 2009, in a overly bullish stance with over 90% now trading above their 200-day moving average and in strong technical up trends.
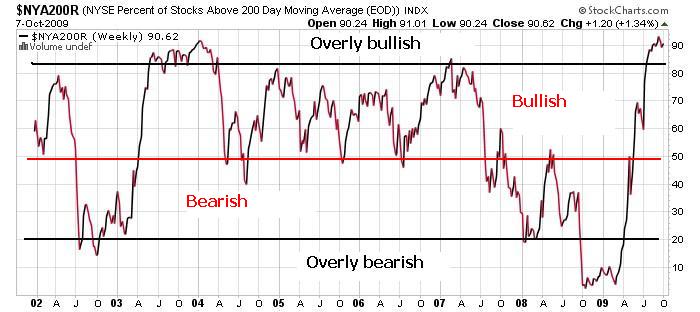
The 200-day moving average is a standard measuring tool for money managers to decide the primary trend of stocks.
This grossly over bullish number has caught the interest of many investors and suggested a high degree of caution is warranted (Chart 1). Yet in reviewing pass performance numbers, equities often remain in these lofty levels far longer than many investors or analysts realize. For example, during the first year of the last bull market (2003), over 80% of stocks on the NYSE Composite firmly held onto their strong bullish trend. It was not until the second year (2004) when some of the 'froth' blow off and the Big Board shifted out of an overly bullish range (80% or higher) and drifted down to a more sustainable bullish zone where only 50% to 80% of equities are in an up trend (trading over their 200-day moving average).
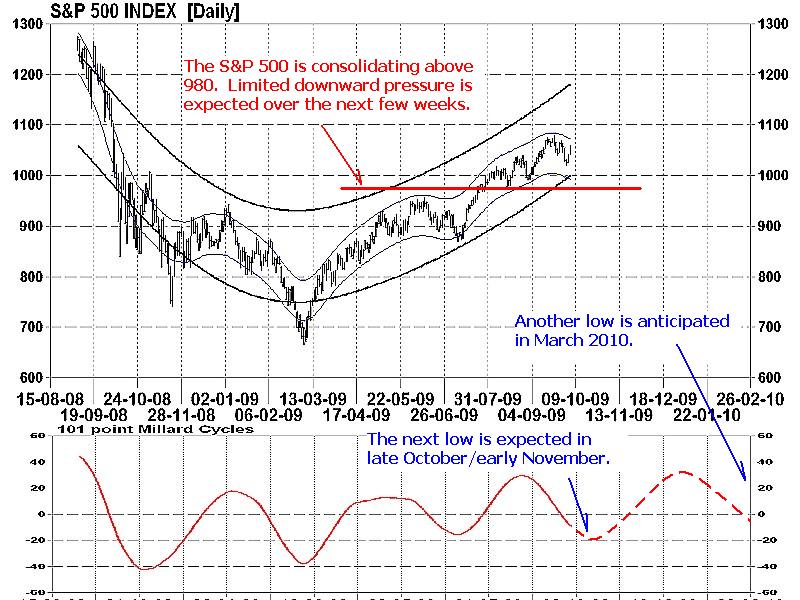
Current performance from the S&P 500 supports this sustained growth spurt (Chart 2). Since the low in March, the two corrections (early July and the expected trough in late October) have been limited with less than 10% corrections. Markets have remained in a very bullish undertone with any sell-offs restricted to shallow and short-term movements.
Bottom line: The present over valued equity markets does represent a challenge for investors on a fundamental basis. Historical performance in similar market conditions (bull market starts) do not always conclude in longer-term sell-offs but rather pauses (consolidations) to allow the fundamentals to eventually catch-up to the technicals.
Data from the bull market crest in 1999 to 2001 indicate equally high valuations as in 2009 but a much lower number of stocks participating in an up trend. Declining market momentum began to appear in late 1999 almost 12 months before the roll over and start of the severe 2000-2002 bear market. The current bullish participation of the NYSE Composite (90%) is more reminiscent of past fledgling bull markets rather than the beginning of market tops.
Investment approach: Valuation analysis should not be ignored and close monitoring of the current levels are still recommended. However, history shows that technical data normally leads the fundamentals. This is because the market is always looking forward and anticipating future events. The present position of many technically-driven indicators illustrate a bullish outlook for the near term. Models point to a coming low in late October to early November and another potentially in March 2010. This first trough, which is expected within fours weeks, illustrates the ongoing upward pressure that can be associated with new bull markets.
The next low in March will represent the first anniversary of the bull market and the probability of the start of less exuberant conditions. Historical data suggest that the overly bullish market stance, on average, lasts only about 3 to 4 quarters. Markets then shift into a more sustainable growth range of 50% to 80%.
More research is available in the October newsletter. Go to www.technicalspeculator.com and click on member login.
Your comments are always welcomed.
By Donald W. Dony, FCSI, MFTA
www.technicalspeculator.com
COPYRIGHT © 2009 Donald W. Dony
Donald W. Dony, FCSI, MFTA has been in the investment profession for over 20 years, first as a stock broker in the mid 1980's and then as the principal of D. W. Dony and Associates Inc., a financial consulting firm to present. He is the editor and publisher of the Technical Speculator, a monthly international investment newsletter, which specializes in major world equity markets, currencies, bonds and interest rates as well as the precious metals markets.
Donald is also an instructor for the Canadian Securities Institute (CSI). He is often called upon to design technical analysis training programs and to provide teaching to industry professionals on technical analysis at many of Canada's leading brokerage firms. He is a respected specialist in the area of intermarket and cycle analysis and a frequent speaker at investment conferences.
Mr. Dony is a member of the Canadian Society of Technical Analysts (CSTA) and the International Federation of Technical Analysts (IFTA).
Donald W. Dony Archive |
© 2005-2022 http://www.MarketOracle.co.uk - The Market Oracle is a FREE Daily Financial Markets Analysis & Forecasting online publication.