


Stocks & Bonds Price Returns vs Total Returns
InvestorEducation / Learning to Invest Nov 30, 2009 - 03:13 AM GMTBy: Richard_Shaw

 Price return is one thing, and total return is another. Most securities charts show price performance.
Total return for yielding securities is greater than price return, because it considers both price changes and investment income. Because some securities are yielding and some are not, and because some securities have low yields while others have high yields, total return is a better indicator of the value of owning a security than price return.
This chart shows both price return and total return for three Dow Jones Indexes:
- stocks: Dow Jones Composite Average Index
- corporate bonds: Dow Jones Corporate Bonds Index
- dividend stocks: Dow Jones U.S. Select Dividend Index
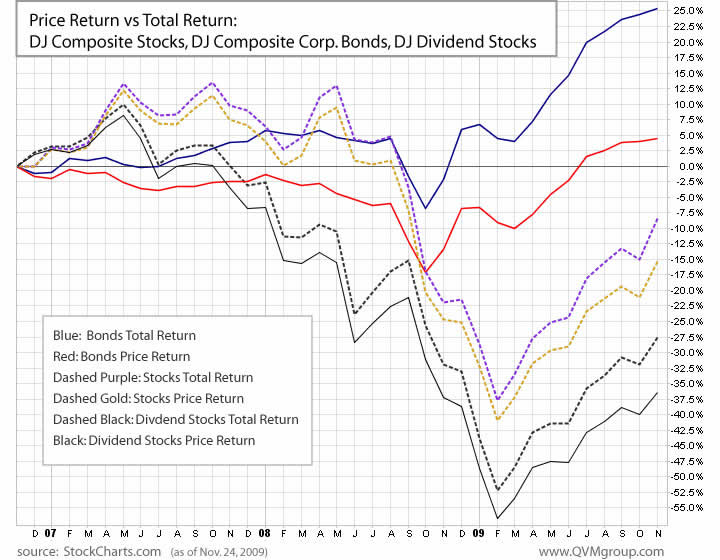
Over the past three years, corporate bonds price return and total return have outperformed stock price and total returns, and composite stocks price return and total return have outperformed dividend stock price and total returns.
The general idea that dividend yield helps support a stock’s price may be true in the long-term, but in the past three years the DJ dividend index didn’t work that way. The extraordinary conditions in 2008 caused an unusual drop in total dividend payments. That was certainly damaging to the performance of dividend stock indexes and funds. However, we still like equity income funds as part of a portfolio for the extra cash flow, and in the belief that the bulk of dividend cuts are behind us.
Aggregate bonds have also outperformed stocks on a total return basis over 1-year, 3-years, 5-years and 10-years, as shown by this table:
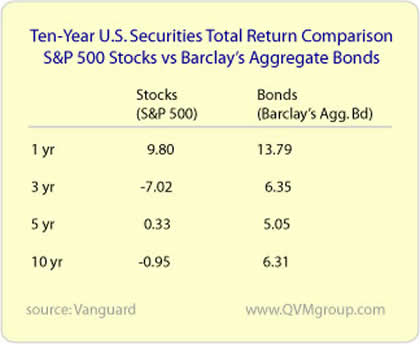
We think far more investors approaching or at retirement will use higher bond allocations than in the past, as a result of the recent carnage in their stock portfolios (if they did not exit stocks prior to full impact of the crash by way of stop loss orders or some other means). We discussed that point in greater detail in our recent article Old Normal Allocation Becomes the New Normal.
Proxy Exchange Traded Funds:
Reasonable investable proxies for the indexes in the chart and table are:
- Inv. Grade Corporate Bonds: LQD, (VCIT just listed)
- Composite Stocks: DIA, IDU and IYT in combination
- Dividend Stocks: DVY
- S&P 500: SPY, IVV
- Aggregate Bonds: BND, AGG
Similar to IDU, but more liquid is the S&P Utility sector fund, XLU. Similar in nature to DVY, but based on different dividend stock indexes are SDY and VYM.
Index Definitions:
 The Dow Jones Composite Average is a price weighted 65 stock combination of the the 30 stock Dow Jones Industrial Average, the 20 stock Dow Jones Transportation Average, and 15 stock Dow Jones Utility Average.
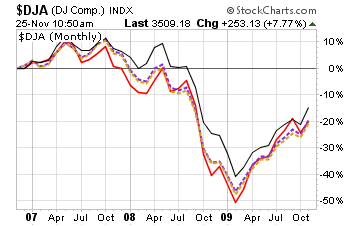
The Dow Jones Composite Average is not as broad a representation of the US stock markets as some other indexes, but its performance is similar. This price performance chart for the DJ Composite versus the S&P 500, the MSCI 750 Prime Market and the MSCI 1750 Small Cap Market shows the reasonable similarity between them all.
The Dow Jones Corporate Bond Index is explained by Dow Jones as “an equally weighted basket of 96 recently issued investment-grade corporate bonds with laddered maturities. … readily tradable, high-grade U.S. corporate bonds. … contains only ‘bullet bonds’, which are non-callable prior to their maturities. … rebalanced each month. Seasoned bonds that have most likely migrated into the hands of long–term investors are replaced with on–the–run issues still active in secondary markets. … a liquidity filter using a minimum issue size of $300 million eliminates small, unobtainable bonds from the index.”
The Dow Jones U.S. Select Dividend Index consists of 100 stocks selected from the Dow Jones U.S. Total Market Index after screening by dividend-per-share growth rate, dividend payout ratio and average daily dollar trading volume, and weighted by indicated annual dividend with individual securities capped at 10%.
Compliance Disclosure:
We own LQD, DVY, SPY, BND, AGG, XLU, SDY, and VYM in some managed accounts. We do not own other mentioned securities. We are a fee-only investment advisor, and are compensated only by our clients. We do not sell securities, and do not receive any form of revenue or incentive from any source other than directly from clients. We are not affiliated with any securities dealer, any fund, any fund sponsor or any company issuer of any security.
By Richard Shaw
http://www.qvmgroup.com
Richard Shaw leads the QVM team as President of QVM Group. Richard has extensive investment industry experience including serving on the board of directors of two large investment management companies, including Aberdeen Asset Management (listed London Stock Exchange) and as a charter investor and director of Lending Tree ( download short professional profile ). He provides portfolio design and management services to individual and corporate clients. He also edits the QVM investment blog. His writings are generally republished by SeekingAlpha and Reuters and are linked to sites such as Kiplinger and Yahoo Finance and other sites. He is a 1970 graduate of Dartmouth College.
Copyright 2006-2009 by QVM Group LLC All rights reserved.
Disclaimer: The above is a matter of opinion and is not intended as investment advice. Information and analysis above are derived from sources and utilizing methods believed reliable, but we cannot accept responsibility for any trading losses you may incur as a result of this analysis. Do your own due diligence.
Richard Shaw Archive |
© 2005-2022 http://www.MarketOracle.co.uk - The Market Oracle is a FREE Daily Financial Markets Analysis & Forecasting online publication.