


Gold Correction, When Will it Bottom?
Commodities / Gold & Silver 2009 Dec 12, 2009 - 04:51 PM GMTBy: Merv_Burak

 The rough period in gold is upon us. Now the question is for how long? I’ll let others answer that question. I’ll just follow the action wherever it takes me. For now that is the down side but it does look like a slight bottoming taking place.
GOLD : LONG TERM
The direction of motion has turned to the down side but not yet to the extent of changing any of the long term indicators. It takes more than a week or two of negative prices to do that. For now, the P&F chart is moving lower but as mentioned last week it would need to drop directly to the $1020 level for a reversal of long term trend. The P&F remains bullish.
As for the normal indicators, the gold price remains well above a positive moving average line. The momentum indicator remains comfortably in its positive zone but has dropped below its trigger line and the trigger has turned to the down side. Just an advance warning for now. The volume indicator continues to look positive and remains above its positive trigger line. At this time the actions of the past week have not affected the long term rating. It is still BULLISH.
INTERMEDIATE TERM
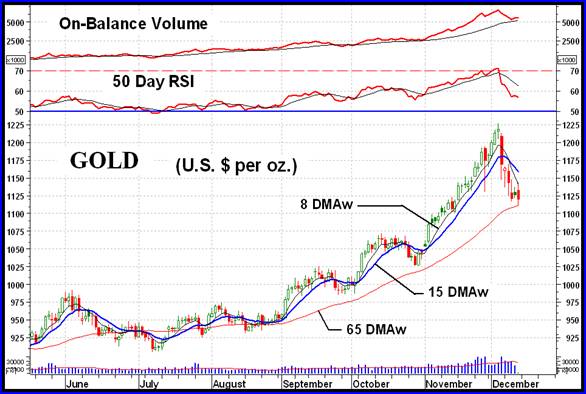
As with the long term, gold price may have had a bad several days but to this point it has not yet had an adverse effect upon the intermediate term indicators. Gold remains above its intermediate term positive sloping moving average line. It’s close and gold seems to be bottoming out just above the moving average line but at this point everything is still positive. As for the momentum indicator, it is on the move downwards and has dropped below its negative sloping trigger line for a warning but still remains in its positive zone. As for the volume indicator, it too remains positive and seems to be turning back to the up side just above its positive trigger line. On the intermediate term the rating remains BULLISH. As confirmation, the short term moving average line has not yet crossed below the intermediate term line. Even the very short term line has not yet done so.
SHORT TERM
As for the short term, that’s a completely different story. The gold price is now below the short term moving average line and the line has turned downward. The momentum indicator has moved into its negative zone and is below its negative trigger line. The daily volume action remains low and is below its 15 day average volume. This is to be expected during a down price move. Putting this together the short term rating is now fully BEARISH.
As for the immediate direction of least resistance, I’m inclined to go for the basically lateral direction. The Stochastic Oscillator is in its oversold zone and appears to be in a turning mode just about ready to cross above its trigger line. The daily price action of the past few days also seems to suggest a possible turning or bottoming going on.
SILVER
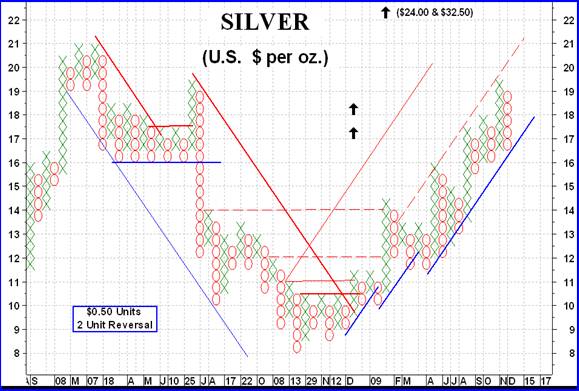
Silver has had some rough times lately, even worse than gold, but despite that it is still in a well defined bullish pattern according to the P&F chart. Until it does some more up and down moves the trend will not reverse till the $15.50 level, which is some distance away.
Despite the still bullish P&F chart, the bar or candlestick chart is telling us a different story. On the long term things are still bullish but that changes on the intermediate term. The silver price has already moved below its intermediate term moving average line and the line slope has turned downward. The momentum indicator is moving lower and just about at its neutral line but still slightly in the positive zone. The indicator has dropped below its trigger line and the trigger has turned towards the down side. The volume indicator is still in a lateral mode but has now dropped below its trigger line and the trigger has turned down. On the intermediate term silver rating is now BEARISH. Some little comfort for now but the short term moving average has not yet crossed below the intermediate term average for confirmation of the bear.
On the short term everything is negative, even the very short term moving average line has crossed below the short term line for confirmation of a short term bear. As for the immediate direction of least resistance, that would be to the lateral similar to gold. It does look like a bottoming process in the price and Stochastic Oscillator so we’ll just have to see how this develops.
PRECIOUS METAL STOCKS
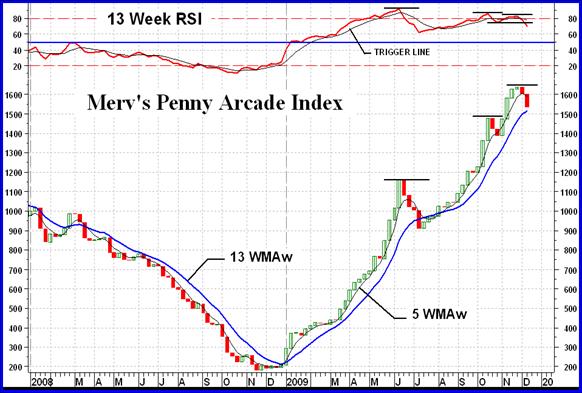
Not a good week for precious metal stocks. Most Indices declined by about 5%, give or take a couple of %. The most interesting Index was the Merv’s Penny Arcade Index.
It wasn’t the decline that was so interesting as the message it seems to be giving us at this time. As the Index has been climbing into higher and higher levels, since its June high, the momentum indicator has been holding back. It has been telling us that the move into new highs has progressively been made on lower and lower strength. The momentum has now dropped below its level reached during the previous reaction in October even though the price is quite some distance from its similar low. This weakness suggests more downside still ahead for the penny stocks. Although not yet bearish should this turn into a rout then it might have grave implications for the quality and second tier stocks. Although there seems to be some distance in time between the down turn of the pennies versus the down turn of the normal stocks it is something to watch out for and not be lulled into gambling or speculating (no one “invests” in gold stocks) when the odds start to get too high for the bear.
Looking over my universe of 160 stocks there were 27 winners and 130 losers. With a ratio of almost 5 losers for every winner I’m surprised that the decline this week was as mild as it was. With this kind of ratio one would have expected a considerable % decline in the Indices. I guess that despite the decline in stocks speculators are not really that bearish as to really dump their stocks but only weed out some losing trades. The next week or two should be interesting.
MERV’S PRECIOUS METALS INDICES TABLE
Well, I think I’ll call it a another week.
By Merv Burak, CMT
Hudson Aero/Systems Inc.
Technical Information Group
for Merv's Precious Metals Central
For DAILY Uranium stock commentary and WEEKLY Uranium market update check out my new Technically Uranium with Merv blog at http://techuranium.blogspot.com .
During the day Merv practices his engineering profession as a Consulting Aerospace Engineer. Once the sun goes down and night descends upon the earth Merv dons his other hat as a Chartered Market Technician ( CMT ) and tries to decipher what's going on in the securities markets. As an underground surveyor in the gold mines of Canada 's Northwest Territories in his youth, Merv has a soft spot for the gold industry and has developed several Gold Indices reflecting different aspects of the industry. As a basically lazy individual Merv's driving focus is to KEEP IT SIMPLE .
To find out more about Merv's various Gold Indices and component stocks, please visit http://preciousmetalscentral.com . There you will find samples of the Indices and their component stocks plus other publications of interest to gold investors.
Before you invest, Always check your market timing with a Qualified Professional Market Technician
Merv Burak Archive |
© 2005-2022 http://www.MarketOracle.co.uk - The Market Oracle is a FREE Daily Financial Markets Analysis & Forecasting online publication.