


Investor Long-Term U.S. Stock Bond Portfolio Allocation Results
Portfolio / Investing 2010 Dec 15, 2009 - 02:06 AM GMTBy: Richard_Shaw

 As you think about your asset allocation and return expectations, you should take multiple historical periods into consideration, as well as current and forward conditions. The basic bonds to stocks mix in a portfolio is one of the primary drivers of overall portfolio return.
Short-term data is easy to access. Long-term data is somewhat more difficult for many investors to find. We’ll leave the current and forward conditions to you in this article, but this data may be helpful with respect to history.
Note: This is a data presentation. No intent to offer conclusions.
How have graduated and rebalanced allocations between US bonds and US stocks performed on a total return basis over many time periods, from short to long?
Let’s look at 1, 3, 5, 10, 15, 20, 25, 30 and 34 years (the longest period the US Aggregate Bond index has existed).
The table below presents the total return (price return + dividend and interest return) for the Barclay’s Aggregate Bond index and the MSCI USA Standard Core index from 1976 on an annually rebalanced calendar-year basis. The return for 2009 is the annualized value for performance through November.
The allocations are in 10% increments for each of bonds and stocks. The resulting 11 allocations range from an aggressive 0% bonds and 100% stocks, to a conservative 100% bonds and 0% stocks.
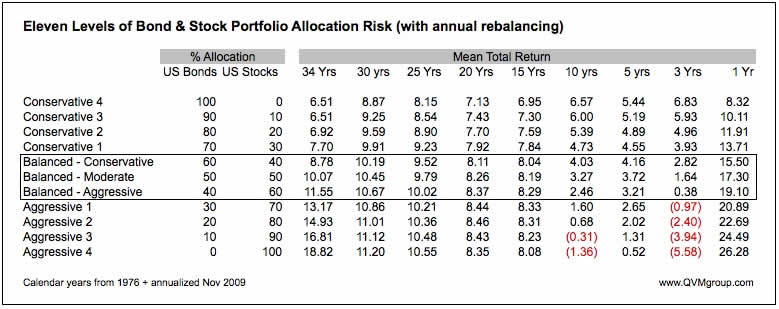
Bonds have been comparatively steady performers over most time periods, while stocks have had substantial variation. Fortunately for those who remained in stocks through 4Q2008 - 1Q2009, or those of us who exited before that time and re-entered after that time, stocks have done very well this year.
The important take-away is that mean returns vary significantly over time, and must be frequently re-evaluated, and should not be assumed to be constant in the future.
The next table shows how the return variation around the mean stratified based on the bond-stock allocation over the full 34 years of the Barclay’s Aggregate Bond index. It shows the mean total return, the worst calendar-year loss, the best calendar-year gain, the standard deviation of annual total return, the number of loss years out of 34, and the statistically suggested range of high to low return for 96% probability (mean return 2 std. dev.) were the future variation to closely resemble the past variation.
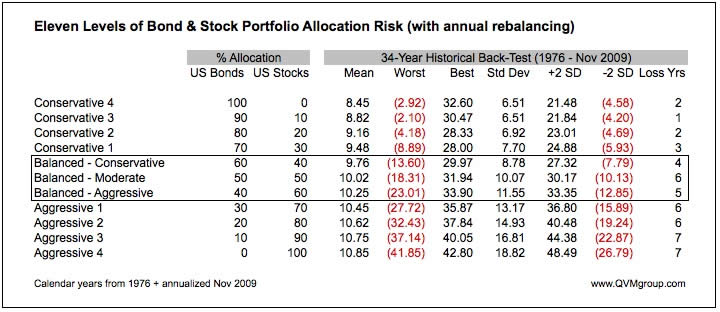
Reasonable proxies for the US stock market are: SPY and IVV (each tracking the S&P 500 index), IWV (tacking the Russell 3000 index), and VTI (tacking the MSCI US Broad Market index) . Reasonable proxies for the US aggregate bond market are: AGG, BND and LAG (each tracking the Barclay’s US Aggregate Bond index).
Within the high variability of returns for US stocks has been a comparatively stable and consistently positive dividend yield. Investors might chose between pursuing price performance or pursuing dividend cash flow. Rebalancing among yielding instruments can have the effect of improving cash flow.
This multi-decade chart of US stocks total return, price return and dividend return illustrates the relative steadiness of investment cash flow versus investment market value.
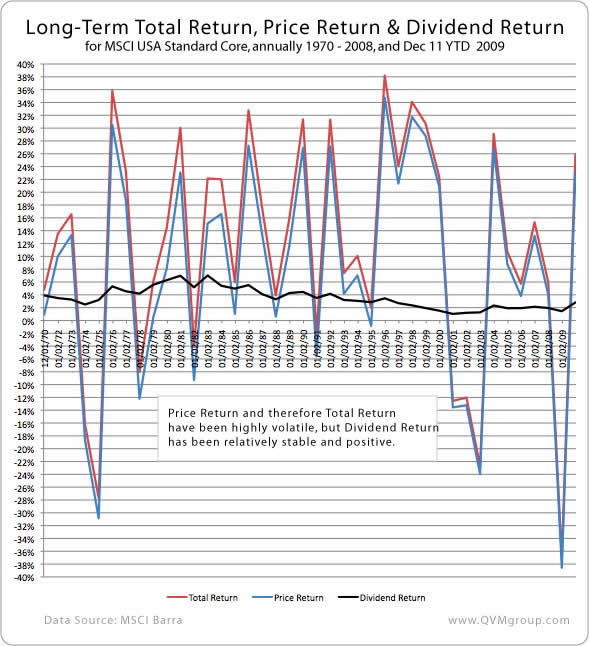
Unlike conventional bond interest, stock dividends tend to grow over time (the past 12-months being an unusual exception). Note that dividend yield fluctuates up and down as price fluctuates, even though the amount of dividends themselves tends to increase.
Over the approximate 40 years of the MSCI USA stock index, the mean total return has been about 9.5%, of which approximately 6.0% has been price return and approximately 3.5% has been dividend return (roughly 37% dividend return and 64% price return).
For those drawing on portfolios to support lifestyle, and who can live with about a 3% draw on current portfolio value, steady stock dividends can create peace of mind while market prices fluctuate. Many investors, of course, are not so well endowed and must be acutely concerned about the effect of a constant or growing draw on a fluctuating portfolio value. Outliving assets is a terrible thing to happen.
The past is not the future, but it’s a good idea to be aware of the past when understanding the present and trying to see into the future. We hope these data will be helpful to the do-it-yourself investor who may be overwhelmed by the present.
Compliance Disclosure: We own SPY, VTI, AGG and BND in some managed accounts. We do not own other mentioned securities. We are a fee-only investment advisor, and are compensated only by our clients. We do not sell securities, and do not receive any form of revenue or incentive from any source other than directly from clients. We are not affiliated with any securities dealer, any fund, any fund sponsor or any company issuer of any security.
By Richard Shaw
http://www.qvmgroup.com
Richard Shaw leads the QVM team as President of QVM Group. Richard has extensive investment industry experience including serving on the board of directors of two large investment management companies, including Aberdeen Asset Management (listed London Stock Exchange) and as a charter investor and director of Lending Tree ( download short professional profile ). He provides portfolio design and management services to individual and corporate clients. He also edits the QVM investment blog. His writings are generally republished by SeekingAlpha and Reuters and are linked to sites such as Kiplinger and Yahoo Finance and other sites. He is a 1970 graduate of Dartmouth College.
Copyright 2006-2009 by QVM Group LLC All rights reserved.
Disclaimer: The above is a matter of opinion and is not intended as investment advice. Information and analysis above are derived from sources and utilizing methods believed reliable, but we cannot accept responsibility for any trading losses you may incur as a result of this analysis. Do your own due diligence.
Richard Shaw Archive |
© 2005-2022 http://www.MarketOracle.co.uk - The Market Oracle is a FREE Daily Financial Markets Analysis & Forecasting online publication.