


Is the Stock Market Correction Over or Just Beginning?
Stock-Markets / Stock Markets 2010 Apr 22, 2010 - 04:58 AM GMTBy: Steven_Vincent

 Equities markets are trading near the highs but a short term lateral correction seems to be in progress.
I like to monitor how the market responds to the stimulus of news items. We have not seen an emergence of the earnings season "sell the news" phenomenon as a general rule so far and that is bullish. Select issues have been hit hard if results have disappointed but others have rallied sharply on positive results and the gains have held.
News on Greece has failed to elicit a significant reaction thus far and it seems that the country's eventual default is broadly accepted as a fait accompli. It may already be priced in and a "buy the news" phenomenon after an initial panic reaction may be a possible scenario. There was little downside follow through to the Goldman mini-panic which is another sign that there are buyers anxious to get on board.
We are likely seeing the leading edge of the investing public buying into the market. The big leap in AAPL after its earnings report smacks of the public piling on late. Reversals are made of this kind of action.
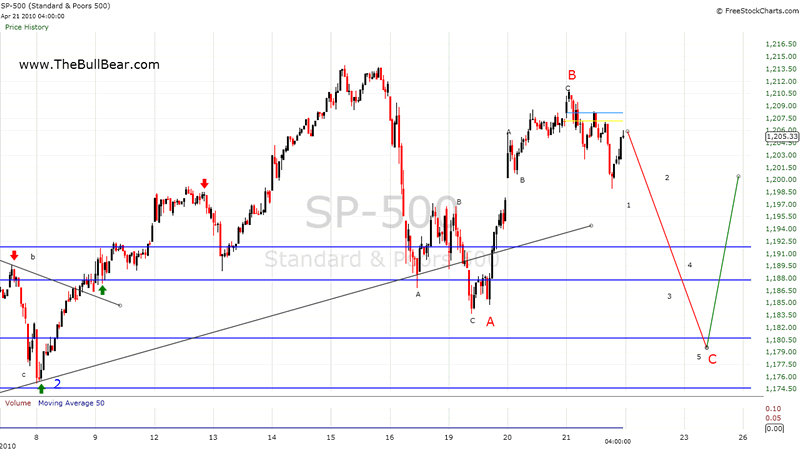
Short term the SPX is apparently correcting in a lateral regular 3 wave ABC flat. The C wave is probably underway and should lead to a bottom in the 1180 support zone. If 1180 does not hold then the January high at 1150 is the next major area of support.
The Total Put/Call Ratio 5 day simple moving average has done an admirable job of predicting market turns over the last year. It is displaying many of the same characteristics that it did at previous tops. Note that in each of the topping instances the ratio bottomed and began to turn up sharply as the market continued to trade laterally for a time.
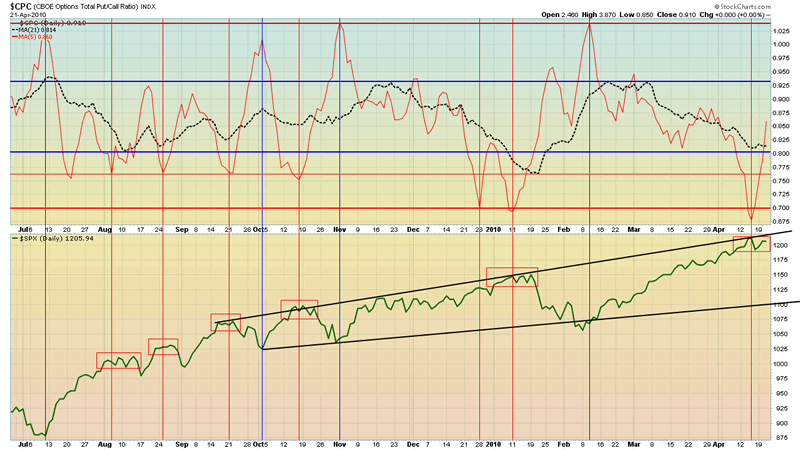
Each time this behavior has corresponded with a touch of the upper boundary of the ascending broadening wedge formation it has resulted in a significant pullback. A possible scenario is that after the shorter term ABC flat correction completes, the market continues to grind higher along the formation's upper rail to a top at the 61.8% Fibonacci retracement level at 1128. From there a more significant correction or rally top may unfold.
The ascending broadening wedge formation is not necessarily bearish. It can also break to the upside. Bulkowski's Encyclopedia of Chart Patterns offers the following insight:
The vast majority of the time (64%, anyway), the pattern acts as a reversal of the prevailing price trend. When the breakout is upward, we find more acting as continuations of the trend than reversals. When the breakout is in the direction of the prevailing market trend (upward breakout, bull market or downward breakout, bear market), reversals outperform continuations.
Only in a bull market with an upward breakout does the pattern begin to shine. Thirty-three percent of the 58 patterns rise more than 45%. For the other categories, do not expect a large gain.
...the lowest failure rates occur in patterns with an upward breakout in a bull market.
Consider the bull market, down breakout...A partial rise correctly anticipated the downward breakout 74% of the time. When a partial rise occurs, prices drop 17% after the breakout, on average, meeting the average decline for ABWs.
Bulkowski also finds that a partial decline into the formation followed by an upside breakout is a reliable predictor of an average 43% rise. That falls in line with my practice of spotting failed setups and taking the opposite side of the trade. Most market participants will no doubt see the potential downside in the trade and exit or sell short. An aborted, partial decline into the formation followed by a reversal and a breakout would be very powerful under those circumstances. Certainly if the pattern were to complete bearishly it would most likely signal the end of the bull run and the resumption of the bear.
Here's another view of the ascending broadening wedge formations in the SPX, NDX and INDU (note these are charts of the futures contracts, not cash markets). Note that each market gives a somewhat different bias towards the eventual resolution to the pattern, with the INDU the most bearish for its partial rise (to date).
On balance I continue to be bullish on the longer term trend but expect some degree of correction in the immediate to near term. Since the predictability of the depth and duration of any correction is unreliable, I would not recommend shorting. Traders should look for an opportunity to lighten up their positions in preparation for a more substantive buying opportunity some weeks out.
Good luck and good trading!
Generally these reports as well as twice weekly video reports are prepared for BullBear Trading Service members and then released to the general public on a time delayed basis. To get immediate access just become a member. It's easy and currently free of charge.

Disclosure: No current positions.
By Steve Vincent
The BullBear is the social network for market traders and investors. Here you will find a wide range of tools to discuss, debate, blog, post, chat and otherwise communicate with others who share your interest in the markets.
© 2010 Copyright Steven Vincent - All Rights Reserved Disclaimer: The above is a matter of opinion provided for general information purposes only and is not intended as investment advice. Information and analysis above are derived from sources and utilising methods believed to be reliable, but we cannot accept responsibility for any losses you may incur as a result of this analysis. Individuals should consult with their personal financial advisors.
© 2005-2022 http://www.MarketOracle.co.uk - The Market Oracle is a FREE Daily Financial Markets Analysis & Forecasting online publication.