


Stock Market Turning Points
Stock-Markets / Stock Markets 2010 Jun 20, 2010 - 03:31 PM GMTBy: Andre_Gratian

 Current Position of the Market
Very Long-term trend - Down! The very-long-term cycles are down and if they make their lows when expected, the bear market which started in October 2007 should continue until about 2014-2015.
SPX: Long-term trend - Up! We are in a medium-term bull market, which is a corrective move within a long term bear market. This bull market should last until 2011
SPX: Intermediate trend - It is likely that the index has made a top of intermediate nature, but this is not yet confirmed.
Analysis of the short-term trend is done on a daily basis with the help of hourly charts. It is an important adjunct to the analysis of daily and weekly charts which determines the course of longer market trends.
Daily market analysis of the short term trend is reserved for subscribers. If you would like to sign up for a FREE 4-week trial period of daily comments, please let me know at ajg@cybertrails.com .
Overview:
The SPX is in a medium-term bull market which appears to be a corrective phase within the secular bear market that started in October 2007 and which is likely to continue until about 2014-2015. This bullish phase is expected to extend into 2011.
After a lengthy rise from March 2009, a decline started at 1220 which found support at the 1040 level in the form of a double-bottom, and the uptrend which began on 6/8 from that level is still in effect, although a minor top is expected to be reached perhaps as early as Monday. A retracement caused by the bottoming 17-wk cycle should take effect and develop into a fairly shallow corrective pattern which could be complete by next week. This cycle was dominant last year, but it has not been consistent historically in the amount of weakness it brings to the market, and it should not be much of a factor as it comes to the end of its current phase.
After this near-term consolidation has taken place, the index should attempt to resume its uptrend, and shortly thereafter make a more important top and start a decline into the 2-yr cycle low.
These are my expectations for the near-term -- subject to adjustments and refinements -- as the SPX continues on its course. At some point in the second half of the year, probably in late August, a more significant decline should take place into the Fall as the 4-year cycle makes its low.
It is not yet clear if 1220 will be surpassed or if there will only be a test of the high, but we should know by the end of August.
Analysis
Chart Pattern and Momentum
Since we already have a pretty good perspective of the longer term trend, and are primarily trying to establish how far the current short-term uptrend will take the index, we'll skip the weekly chart and go directly to the Daily Chart.
After reaching 1220, the SPX first broke out of the black up-channel and almost immediately afterwards, also broke out of the blue intermediate channel from March 2009. This was a signal that the intermediate trend had most likely reversed, especially since the weakness took the index below its 200-DMA and the MACD dropped below its former low of early February (as we will see later, this is also indicated by the NYSI).
By the second test of the 1040 level on 6/8, positive divergence had developed in the two lower oscillators and this told us to expect another short-term reversal. But when it occurred, it was difficult to assess just how much of a rally the index would muster considering that there were two important cycles slated to make their lows in the near future. We know now that the first cycle has had little effect on the uptrend, and since prices have again risen above the 200-dma, this has generated a potential target of 1136-1137.
The two dotted trend lines drawn from the top are resistance lines. Prices have reached the first one which is also the level of the 50-dma. With the 17-wk cycle expected to make its low next week, it is likely that the index will pause in this area, and then go on to complete the rally at the next dotted trend line which, by the time it gets there, will be in the vicinity of the anticipated target. By then, the indicators will probably be in a position to give a sell signal, and prices should then retrace into the 2-yr cycle low.
It is not possible to determine at this time how much of a decline will be generated. The odds are fairly good that 1040 will not be penetrated before the cycle bottoms. After the decline is complete, another uptrend rally should begin which may be in a position to test the 1220 high. In fact, since prices have held at 1040, we are technically still in an intermediate uptrend and it is possible that we could see a new high before prices come under pressure from the bottoming 4-year cycle.
We'll now turn to the Hourly Chart to examine up close the near-term topping formation developing at the first dotted resistance line and at the 50-dma.
The green channel outlines the current uptrend from 6/8. The first top on 6/16 already represented a move away from the top of the channel. After breaking the inner channel line, on Thursday the index found support on the outer channel line but has not been able to move away from it. Negative divergence with the oscillators is increasing, and the structure looks as if only one more little thrust is needed to complete this phase. This is confirmed by the Point & Figure chart which has a near-term count of 1125-1127. Everything considered, it would seem that a reversal is imminent.
The red dashed line at 1099 represents the level of the 200-dma and looks like a good retracement level where the index could find support and consolidate before its final move to 1136-37.
That's the anticipated scenario for the next week or ten days. Let's see if the market obliges.
Cycles
The 17-wk cycle is ideally due next week. The 2-yr cycle, some time in July.
The 4-yr cycle is due in the Fall and could nest with the next 17-wk and the next 9-mo cycles to create an intermediate low.
Projections:
The last little shelf which formed on Friday projects a P&F count to 1125-27. After a pull-back into the 17-wk cycle low, a final rally move to 1136-37 is anticipated. The target is marked with a pink horizontal line on the hourly chart.
Breadth
The NYSE Summation index (courtesy of StockCharts.com) may be giving us a warning about the longer term trend. Since its August peak of last year, the index has been in a downtrend, making a series of lower lows.
Over the short-term, note how weak the uptrend from 6/8 has been. On that date, the index made a much lower low than the Feb low while the SPX held at 1040 and essentially made a double bottom; and the NYSI recovery from that low has been puny. It has not even been able to get back into positive territory. I believe this is a sign that we did make an intermediate top at 1220 and that the SPX is going to have a rough time trying to overcome it.
Market Leaders and Sentiment
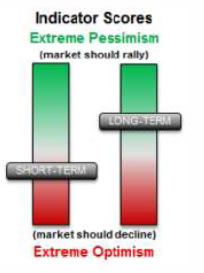
As the rally has progressed, sentiment -- according to the SentimenTrader (courtesy of same) -- has deteriorated from its extreme bullish position of a couple of weeks ago, but is still predominantly bullish. This should tell us that the rally is probably not quite over, and this basically agrees with the cyclic configuration and the position of the daily indicators.
Two weeks ago, the following indicator (also courtesy of StockCharts.com) was very bullish and showed the strong relative strength of the NDX vs. SPX. Currently, the bullishness has been tempered to neutral and perhaps is even a tad bearish. This basically agrees with sentiment and the daily indicators that the shortterm rally is near its end, but is not necessarily over just yet.
Gold
After a short period of consolidation, GLD made a new high last week. This is not surprising since we have a potentially higher target for it, perhaps as high as 128. That target is reinforced by the P&F pattern of the recent correction which also has a projection count to 128, which makes the achievement of that level very likely.
Negative momentum divergence has begun to appear in the indicators of both the daily and weekly charts. If it is still there by the time the 128 target is reached, it will not only confirm the end of the move but, because the weekly chart is involved, it could indicate the need for an intermediate correction. Since the structure of the weekly chart also suggests that it might be complete at that level, one should not ignore the 3 confirmation signs of a top: projection achieved, divergence, and structure completion.
Here is the Weekly Chart of GLD:
The correction target will be discussed after the final intermediate high has been reached.
Summary
Near-term, the SPX appears to be ready for a brief consolidation. Based on the prevailing cycles, this should be followed by a resumption of the uptrend with a potential final short-term destination of about 1137.
A correction should then take place as the 2-yr cycle makes its low; after which there should be another final rally into late August, followed by a substantial decline into the 4-yr cycle low in the Fall.
If precision in market timing is something which is important to you, you should consider a trial subscription to my service. It is free, and you will have four weeks to evaluate the claims made by the following subscribers:
Awesome calls on the market lately. Thank you. D M
Your daily updates have taken my trading to the next level. D
… your service has been invaluable! It's like having a good technical analyst helping me in my trading. SH
I appreciate your spot on work more than you know! M
But don't take their word for it! Find out for yourself with a FREE 4-week trial. Send an email to ajg@cybertrails.com .
By Andre Gratian MarketTurningPoints.com
A market advisory service should be evaluated on the basis of its forecasting accuracy and cost. At $25.00 per month, this service is probably the best all-around value. Two areas of analysis that are unmatched anywhere else -- cycles (from 2.5-wk to 18-years and longer) and accurate, coordinated Point & Figure and Fibonacci projections -- are combined with other methodologies to bring you weekly reports and frequent daily updates.
“By the Law of Periodical Repetition, everything which has happened once must happen again, and again, and again -- and not capriciously, but at regular periods, and each thing in its own period, not another’s, and each obeying its own law … The same Nature which delights in periodical repetition in the sky is the Nature which orders the affairs of the earth. Let us not underrate the value of that hint.” -- Mark Twain
You may also want to visit the Market Turning Points website to familiarize yourself with my philosophy and strategy.www.marketurningpoints.com
Disclaimer - The above comments about the financial markets are based purely on what I consider to be sound technical analysis principles uncompromised by fundamental considerations. They represent my own opinion and are not meant to be construed as trading or investment advice, but are offered as an analytical point of view which might be of interest to those who follow stock market cycles and technical analysis.
Andre Gratian Archive |
© 2005-2022 http://www.MarketOracle.co.uk - The Market Oracle is a FREE Daily Financial Markets Analysis & Forecasting online publication.