


What To Do After Monday’s Stock Market Gap Up
Stock-Markets / Stock Markets 2010 Aug 03, 2010 - 07:12 AM GMTBy: David_Grandey

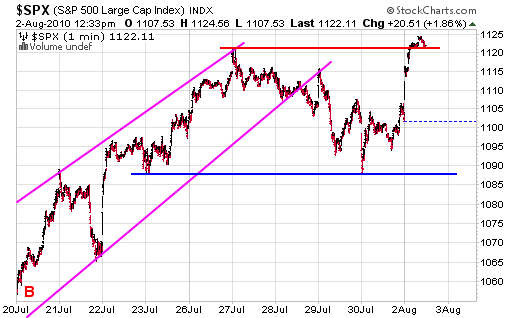
 The S&P 500 closed at 1101 on Friday and 3 minutes into the open Monday it is at 1116! Then we INSTANTLY backed off up to the ISM number and on that news we got an instant knee jerk to you guessed it to the 1120ish level and ended up closing at just shy of 1126.
So why did the market pop on the ISM number? I mean last month it was at 56.2% and this month it was at 55.5% So what gives? Simple, we can sum it up in two words: ABOVE CONSENSUS.
So when this happens, it’s buy, buy, buy right. Well, there’s one catch — 90% of the move came in the form of the gap. When these type of things happen? We step away.
It’s one thing if we would have opened flat or down but when 90% of the whole move to the 1st level of resistance takes place in 3 minutes? That’s nuts and makes us say thanks anyway as we don’t chase buses.
From Friday’s close to 3 minutes into the new market day to pop like we have and buy something is the equivalent of “Chasing A Bus”
Just look at MELI for example. This issue closed Friday at 60.50, opened Monday at 62.28 and INSTANTLY SOLD OFF!
Then look at RIMM. Late last week came the news driven hype to the upside and Monday news driven hype to the downside. Yep just as frustrating for the bulls as well as the bears if you ask us.
In our mid-day update to our subscribers on Friday we said :
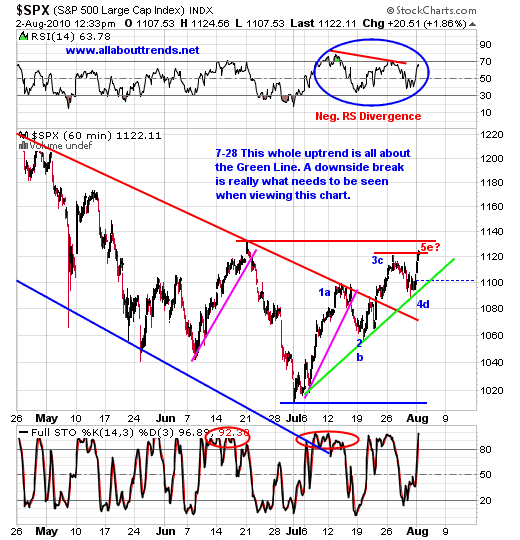
“Part of us would feel safer seeing a retest of recent highs for a mini double top (little red line at 1120 or even the 1131 level before a drop as that would mark a double top at a retest of 1120 and/or a 5th and final wave higher.”
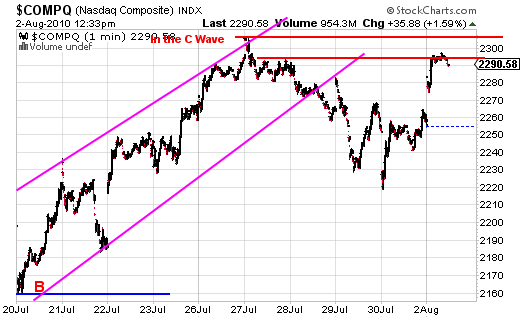
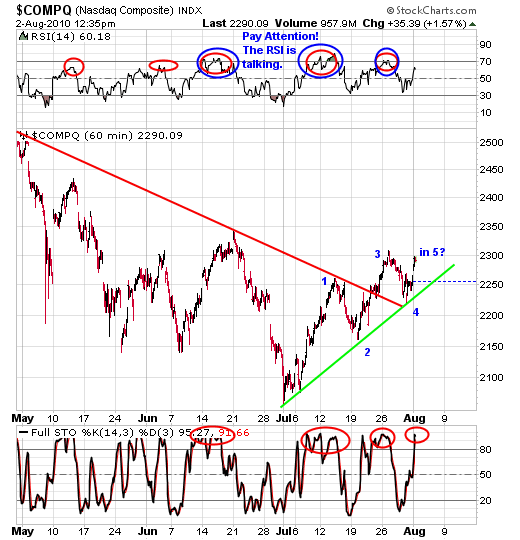
One look at the index charts below tell the story.
So are we closer to trading range support or resistance?
In Summary:
Given everything above weare at one resistance level as we speak with the next one (1131) not far away. Also, let your stocks tell you what to do. For us, we have 4 short-sell positions. And with the markets up big Monday 3 of the 4 closed in the red. That tells us something.
By David Grandey
www.allabouttrends.net
To learn more, sign up for our free newsletter and receive our free report -- "How To Outperform 90% Of Wall Street With Just $500 A Week."
David Grandey is the founder of All About Trends, an email newsletter service revealing stocks in ideal set-ups offering potential significant short-term gains. A successful canslim-based stock market investor for the past 10 years, he has worked for Meriwest Credit Union Silicon Valley Bank, helping to establish brand awareness and credibility through feature editorial coverage in leading national and local news media.
© 2010 Copyright David Grandey- All Rights Reserved Disclaimer: The above is a matter of opinion provided for general information purposes only and is not intended as investment advice. Information and analysis above are derived from sources and utilising methods believed to be reliable, but we cannot accept responsibility for any losses you may incur as a result of this analysis. Individuals should consult with their personal financial advisors.
© 2005-2022 http://www.MarketOracle.co.uk - The Market Oracle is a FREE Daily Financial Markets Analysis & Forecasting online publication.