


A Closer look at the Stock Market, XAU Death Cross
Stock-Markets / Stock Markets 2010 Aug 06, 2010 - 06:37 AM GMTBy: Clif_Droke

 Market technicians sometimes let their imaginations carry them away. Because of the dry, tedious nature of the business, they sometimes exaggerate the importance of a technical signal by drawing to attention to what would otherwise be a non-event.
Take for instance the simple moving average crossover. This rather pedestrian occurrence can be seen whenever the rolling price average of a stock or market index crosses above or below a moving average of longer duration. When the 50-day moving average for the S&P 500 Index crossed under the widely followed 200-day MA, market technicians the world over had a field day.
The crossover involving the 50-day/200-day MA last month was widely hailed as a “death cross” by technical analysts, who soon began publishing gloom-and-doom forecasts based on this simple event. Hundreds of blogs, newsletters and newspaper articles were dedicated to explaining to the investing public why a simple moving average crossover carried the seeds of destruction for the U.S. equities market. The “death cross” as it has been christened is supposed to be a sure-fire harbinger for a bear market and a signal to savvy investors to liquidate stock holdings.
Indeed, many traders have taken a bearish view of the stock market at the exact time the S&P 500 Index (SPX) technically confirmed an immediate-term bottom for us in early July by breaking out above its 15-day moving average. We keep hearing talk in the financial press about the “death cross,” which is supposed to spell doom for the stock market whenever it occurs. The truth of the matter is that the indicator only works sporadically.
Had we not already suffered through the May panic sell-off and if equity prices were higher than they are now, one might easily concede that the “death cross” should be construed as an exit signal for investors long the stock market. But as it stood entering the month of July when the “death cross” occurred, the market has just had a major short-term cycle bottom. The various put/call ratios and investor sentiment readings were also suggesting the market had real turnaround potential.
Along those lines, an observer made the following comments recently: “Clif, you were the original in comparing this summer’s crisis with 1998. Many thanks; that helped me see this (below) from 1998, as all lamented together the famous death cross of the 50-day / 200-day MA combo….I just went to 1998 and saw the same thing around the “buy!”
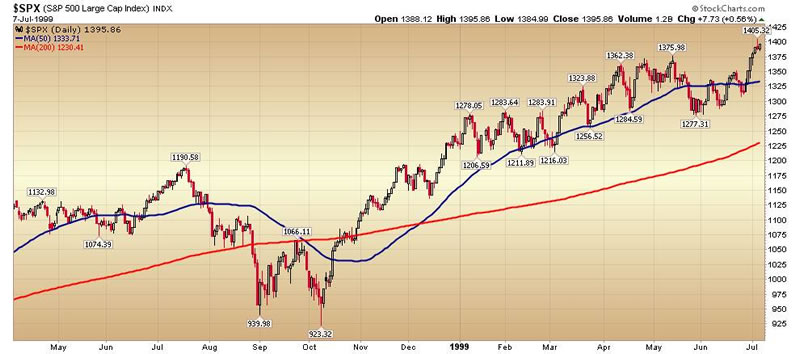
He adds, “Looks like the famous ‘death cross’ was a meaningless indicator in 1998, about the last we have worldwide summer contagion fears. What makes it even more meaningless today is that everyone talks about it.
This is a good observation. It’s true that too many people have been talking about the “death cross” for it to have any sort of validity, at least in the near term. Alan Abelson in a recent Barron’s column made reference to the possibility that the death cross may have become a contrarian indicator. He referenced a survey done by The Chart Store (www.thechartstore.com) which looked at all the “death crosses” since 1930 and found that “somewhat more than half the time, the stocks were higher a month or two later.” From now on, whenever the 50-day MA crosses under the 200-day MA following a serious corrective decline and bottoming process in the stock market, perhaps it should be considered a contrarian reversal indicator instead of a “death cross.”
The only time the “death cross” has reliable forecasting ability in terms of predicting a bear market is when the 50-day moving average cross under the 200-day MA following a period of pronounced internal weakness. This weakness is reflected in the daily NYSE 52-week new highs-new lows, which represents the incremental demand for stocks. When new lows have been expanding consistently or when the rate of change (momentum) of the new high-new low differential is declining on a short-, intermediate-, and long-term basis, there is every reason to fear that a “death cross” could turn out to be legitimately forecasting a market crash or bear market. That wasn’t the case in July when the infamous “death cross” made its most recent appearance.
Another observation is that when a stock or market index has already taken a sizable hit and is coming off a prolonged bottoming process, there is reasons to suspect that a “death cross” will prove to be misleading. An example of this occurred in the XAU Gold Silver Index in September 2006. The 50-day moving average for the XAU crossed under the 200-day MA in late September that year, yet the gold stocks had already experienced a significant corrective decline and were coming out of a lengthy bottoming process as you can see in the XAU chart. Moreover, internal momentum for the gold mining stock group was quite strong at that time as measured by the rate of change in the number of stocks making net new highs. This had a strong forecasting validity for the gold price itself and told the astute investor that the “death cross” in the XAU was likely to be a “head fake”, which indeeds it proved to be.
Moving averages are a wonderful tool to use when trading in stocks and ETFs but their use must be tempered by a comprehensive market analysis. Exclusive reliance on a simple moving average like the 200-day MA, or making too much of a moving average crossover signal are both mistakes to be avoided. There is a time and a place for moving average crossover signals but only when the crossover is backed by other technical indications. Education is of paramount of importance in learning the right time and place for using moving averages. Let it suffice for now that when media pundits start hailing a simple market indicator as a harbinger of doom, the best policy is to assume that emotions have gotten the best of reason and to ignore the hype.
Moving Averages
Classical trend line methods can be useful but they aren’t particularly suited for a fast-moving, dynamic market environment. This is especially true where turning points occur rapidly in a market that is subject to cyclical crosscurrents as 2010 has been at times. That’s where moving averages come in handy.
With a good moving average system a trader can be reasonably assured of catching most of the important moves in an actively traded stock or ETF while eliminating many of the whipsaws that attend trading choppy markets. In the book “Stock Trading with Moving Averages” we discuss some market-tested methods that have proven successful across most major stock sectors and industry groups, and is especially geared toward the gold and silver mining stocks and ETFs. Here’s what one reader had to say about the book: “...you were the one who supercharged my charting with your moving average book ‘Stock Trading with Moving Averages’ and your constant analysis of the double and triple moving average series.”
Moving averages offer another advantage over trend lines in that they can be tailored to closely fit the dominant short-term and interim market cycles. They’re also more compatible with a trading range-type market…if you use the right moving average system. These and other strategies and tactics are discussed in “Stock Trading with Moving Averages.” Click here to order:
http://www.clifdroke.com/books/book14.mgi
Order your copy today and receive as an added bonus a copy of my latest booklet which discusses the best long-term moving averages to use with stock trading.
By Clif Droke
www.clifdroke.com
Clif Droke is the editor of the daily Gold & Silver Stock Report. Published daily since 2002, the report provides forecasts and analysis of the leading gold, silver, uranium and energy stocks from a short-term technical standpoint. He is also the author of numerous books, including 'How to Read Chart Patterns for Greater Profits.' For more information visit www.clifdroke.com
Clif Droke Archive |
© 2005-2022 http://www.MarketOracle.co.uk - The Market Oracle is a FREE Daily Financial Markets Analysis & Forecasting online publication.
Comments
|
Graham
08 Aug 10, 07:57 |
death cross
Clif, hindesite is wonderful is it not ? |