


Gold Charts Don't Match Bullish Expectations of Commentators
Commodities / Gold and Silver 2010 Aug 29, 2010 - 11:26 AM GMTBy: Merv_Burak

 Too much verbal euphoria, not enough trading euphoria. As an old underground gold miner from long ago I remain somewhat of a gold bug BUT looking at the charts one must be very, very cautious here. The futures trading activity just doesn’t seems to match the expectations of many commentators at this point.
GOLD : LONG TERM
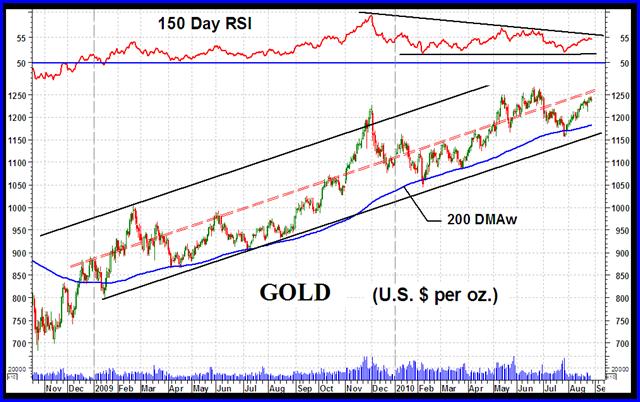
It’s been a while since I showed a gold chart from a longer term perspective. My usual chart is a short term one. Here we see an interesting long term trend. It’s well defined within an up trending channel that goes back almost two years. Before commenting on the gold price trend itself let’s just take a quick look at the long term momentum indicator shown (the 150 day RSI).
Since turning positive in early Dec of 2008 the long term momentum of the gold price move has basically remained positive since. However, one can easily see that the strength of the momentum peaked in late 2009 and has not reached that strength since. The gold price move into new highs a couple of months back was not confirmed by a new peak in the momentum. The strength of the gold price move has diminished over time. This is what technicians call a negative divergence. If one looks closely one can visualize the momentum starting a turning process suggesting a possible topping out of the price action ahead.
Momentum indicators such as this one DO NOT predict any specific action ahead NOR do they provide any suggestion of timing. They are primarily WARNING indicators of what is happening and by extension, what one might expect ahead. Here we have a warning of continuing diminishing of price action strength with the suggestion that a reversal of price trend may result. As for timing, it could start tomorrow or it might take years before the turn. I have seen momentum indicators that continued to get progressively weaker slowly for years before turning negative. As for the price, it continued to gain altitude during those years until a final turn around. Use momentum indicators as cautionary warnings, use trend indicators for market timing.
Now a look at the price action. Short term trends are easy to spot. As they continue there is a point where we start to call them intermediate term trends. As these continue we call them long term trends. That’s how the action progresses. In addition, during a long term trend we have intermediate term reactions and during long and intermediate term trends we could have short term reactions. Trying to decipher what’s what is the task of a technician to justify their hard earned salaries.
One can quickly see the price trend trapped inside an up trending channel and staying above its positive sloping up trending long term moving average line. It had dropped below the line very briefly several times during its advance and each time the reversal back above the line had been a good buying opportunity. This is often the case in stocks and provides a good opportunity for getting in on a stock advance once the move had already been on its way. The one thing to be sure of before acting is that the slope of the moving average line remains positive throughout. But I start to deviate.
The most basic of concepts is that the trend remains positive (i.e. bullish) as long as the price remains above a positive long term moving average line and also in this case, inside its up trending channel. By drawing a mid channel trend line (the red dashed line) one has a warning line. Below the mid line is the place where one could purchase gold while above the mid line one should sit back and wait for a reaction back to the lower area. Once the price is back to the lower half of the channel one would then use short term trend analysis to wait for the trend to turn upwards before buying. No use buying while the trend is still moving lower, whether in the lower half or not.
It is often thought that once we have a well defined channel that the mid line will be a cut off line where 50% of the activity will take place above the line and 50% of the activity will take place below the line. This happens sometimes but is not a good rule to use in any trading criteria. More often it does define, as it shows here, a support/resistance line.
Enough for now, despite the weakening in the price move we are still in BULLISH long term territory.
INTERMEDIATE TERM
For the intermediate term analysis I use a 50 day version of the RSI (Relative Strength Index). Looking at a chart the momentum remains above the neutral line in its positive zone. It is also above a positive trigger line that I use to determine the direction of the line as opposed to the positive or negative position of the line. Although positive and above its trigger one can see a slight turning towards the horizontal in its recent actions. The momentum has not yet turned downward but it looks like it wants to head in that direction. The price of gold itself is above its positive sloping moving average line indicating a continuing intermediate term trend. The volume indicator had made a new high a week ago but although the price was able to make a higher rally high this past week the volume indicator did not do the same. Again, a possible indication of loss of strength or in this case a loss in speculative interest in gold. Still, the indicators remain BULLISH for the intermediate term, at this time. The short term moving average line confirms this rating by remaining above the intermediate term line.
SHORT TERM
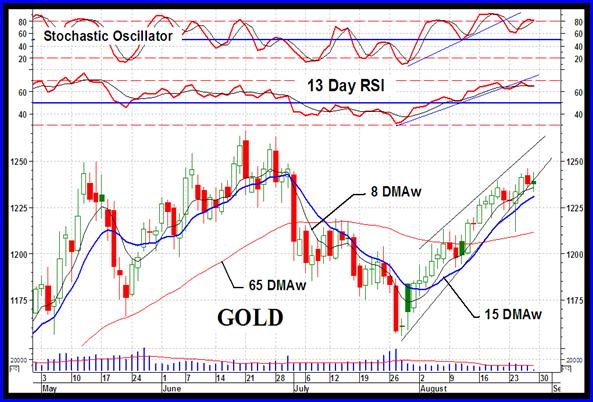
Trend lines are very common in indicators and usually their breaking is ahead of any breaking of trend lines in the price chart. Here we see trend lines in the short term momentum indicator and the more aggressive Stochastic Oscillator, both broken over a week ago. The past week’s movement by the gold price into new highs was not noted on the indicators which seemed to have reversed back to the down side at the end of the week. The price pattern itself suggests an up trending wedge pattern, which appears broken on the Friday close. What we see at the present time are indicators which are still telling us one story while the trends are suggesting the story to be old news.
The action by gold during the week still took place above its positive sloping moving average line. The momentum indicator is still in its positive zone although it has dropped below its trigger line and the trigger has now turned slightly negative. The daily volume action remains low and no help. All in all, the indicators are still giving us a rating of BULLISH. The very short term moving average line continues to confirm this rating by staying above the short term line.
Despite the positive indicators the immediate actions of these indicators is not all that positive. The momentum and Stochastic Oscillator had both crossed below their up trend lines and both have failed to make new highs this week with the gold price. The gold price itself appears to be topping out with the Friday close having closed below its up trend line. All in all the immediate direction seems to be towards the down side. It may still take another day or more to really catch on but that seems to be the direction of motion. I’ll guess that we will see a couple days of action that are more lateral than up or down.
SILVER
The commentary on silver will be short today. Time constraints.
Silver made a short term break out this past week but the actions on Thursday and Friday seem to suggest it’s not going far. We may, in fact, be about to see some downside activity at the beginning of the week. Despite this the ratings for all three time period is BULLISH. The trend does need a little more upside before it breaks above its ceiling from the trading over the past several months. That would require a move to the $20 level. Until then although the ratings may be bullish the overall trend remains basically lateral.
PRECIOUS METAL STOCKS
While most North American Indices are having a hard time trying to break into new highs, above their 2008 highs, the Merv’s Composite Index of Precious Metals Indices is showing that the overall industry is in fact making new highs. As previously mentioned this Index shows the average weekly performance of all of the component members of the Precious Metals Table which appears at the end of these commentaries each week. The driving forces behind this performance of the Composite Index are the 8 Merv’s Indices which reflect various sectors of the precious metals markets. Only two of the Merv’s Indices have not yet made their new highs, the Gamb-Gold Index of gambling variety stocks and the Qual-Silver Index. The overall Merv’s Gold & Silver 160 Index of 160 stocks is well into new all time highs and suggesting that the precious metals industry is, at this moment in time, performing very well. So, which Indices should one pay more attention to, the usual North American Indices or the Merv’s Indices? I think that the Merv’s Indices give one better information of the on going performance of the industry. Having said that there is a serious cautionary note in the Merv’s Indices which is also reflected in the Composite Index.
As shown in the chart the recent May-June highs in the Composite Index was not confirmed by new highs in the long term momentum indicator. This week’s move by the Composite into still higher highs again was unconfirmed by the indicator, which is still below its May-June levels. These highs were made on reduced strength. If such reduction in strength should continue it could lead to a move by the indicator into negative territory taking the Index with it. As mentioned in the gold commentary above this is a warning indication, not a sure thing, nor does the indicator provide timing for a reversal of trend. We just have to keep watching it as things develop.
Merv’s Precious Metals Indices Table
Well, that’s it for another week.
By Merv Burak, CMT
Hudson Aero/Systems Inc.
Technical Information Group
for Merv's Precious Metals Central
For DAILY Uranium stock commentary and WEEKLY Uranium market update check out my new Technically Uranium with Merv blog at http://techuranium.blogspot.com .
During the day Merv practices his engineering profession as a Consulting Aerospace Engineer. Once the sun goes down and night descends upon the earth Merv dons his other hat as a Chartered Market Technician ( CMT ) and tries to decipher what's going on in the securities markets. As an underground surveyor in the gold mines of Canada 's Northwest Territories in his youth, Merv has a soft spot for the gold industry and has developed several Gold Indices reflecting different aspects of the industry. As a basically lazy individual Merv's driving focus is to KEEP IT SIMPLE .
To find out more about Merv's various Gold Indices and component stocks, please visit http://preciousmetalscentral.com . There you will find samples of the Indices and their component stocks plus other publications of interest to gold investors.
Before you invest, Always check your market timing with a Qualified Professional Market Technician
Merv Burak Archive |
© 2005-2022 http://www.MarketOracle.co.uk - The Market Oracle is a FREE Daily Financial Markets Analysis & Forecasting online publication.