


The Gold-Silver Ratio, Another Look
Commodities / Gold and Silver 2011 May 13, 2011 - 01:59 PM GMTBy: Casey_Research

 Andrey Dashkov, Casey International Speculator writes: The gold-silver ratio (GSR) measures how many ounces of silver one can purchase for an ounce of gold, on a certain date.
Reference to the ratio has a long history. One of the first mentions was that upon the death of Alexander the Great, the ratio was 12.5 to 1. During the Roman Empire, the ratio was set at 12. By the late 19th century, the ratio had risen to 15.
Interestingly, these historical ratios roughly reflect geologists’ estimates that silver is 17 times more abundant than gold in the earth’s crust. This gives many investors a reason to believe that 17 is the natural balance between these elements, and that eventually the GSR will return to it.
Monitoring the GSR is quite popular among gold and silver investors. It seems that whenever it makes a big move, many start drawing conclusions about the direction of the prices of its underlying metals.
Here at Casey Research, we stick to the dictum that the GSR “suggests a lot but proves nothing.” Indeed, the GSR is determined by the price action of gold and silver; the price action of gold and silver is not determined by the GSR. Rather, each metal’s price is influenced by various fundamental factors. What complicates any analysis of interactions between gold and silver prices is that the two metals have different markets, each with peculiar supply and demand structures.
Briefly reviewed, the gold market is characterized by a large above-ground supply as the vast majority of gold ever mined still exists in refined form, and annual mine supply represents only a small fraction of that volume. Demand is mostly for jewelry and investment. Gold is not widely used for industrial purposes.
Silver demand, by contrast, is mainly for industrial fabrication of things like electronics and batteries. The metal is consumed during the process and removed from above-ground stocks. The other major areas of demand are jewelry, investment, photography, coins and household silver, in that order. Supply comes mainly from mining and scrap recycling.
From this picture comes one conclusion: over time, supply and demand for the two metals has been fluctuating in response to industrial and technological advancements, shifts in monetary systems and market turbulence. Today, as investment and jewelry are the primary sources of gold demand and most of the silver goes into industrial and related applications, it is no surprise that the gold-silver ratio is different than the historical average of 17. The following chart shows how the ratio has fluctuated since 1968.
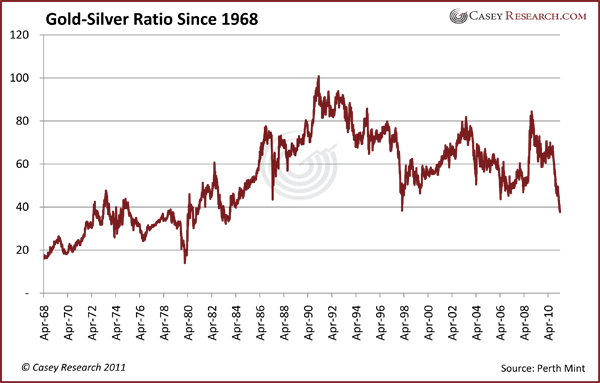
The GSR was extremely volatile over the past five decades and averaged 53.5 from 1968 to April 2011; during the last ten years (since April 2, 2001), the ratio averaged 61.8.
The ratio has been falling for several months, however, as shown on the chart above. Counterintuitively, however, rumors that a low GSR signals undervalued silver started spreading. We say counterintuitively here since it is unclear why a falling GSR should signal undervaluation after silver gained over 80% within a year. Appeals to the mega-long-term GSR of 17 alone do not seem to provide enough basis to think that silver will continue to soar indefinitely.
As of April 1, the GSR stands at 37.7. We, however, do not think that it is going to fall to 20 or 15 from this point: history shows that high volatility is the ratio’s essence. After a plunge, there usually follows a rapid surge. That happened in 1980 when gold reached its inflation-adjusted peak, and in 1987 and 1997. We don’t know how steep the current plunge in the ratio will be, of course, but using history as a guide, we do not expect the ratio to continue its decline for much longer.
Uncertainty about the economic recovery in the Western world and the growth of developing countries can result in slowing industrial output and hence falling demand for silver that would hinder the price. These conditions also create a favorable environment for gold driven by safe-haven demand. In such circumstances, the ratio may climb.
History shows that the GSR tends to rise significantly during a recession and create an interim peak on the way. See the chart below.
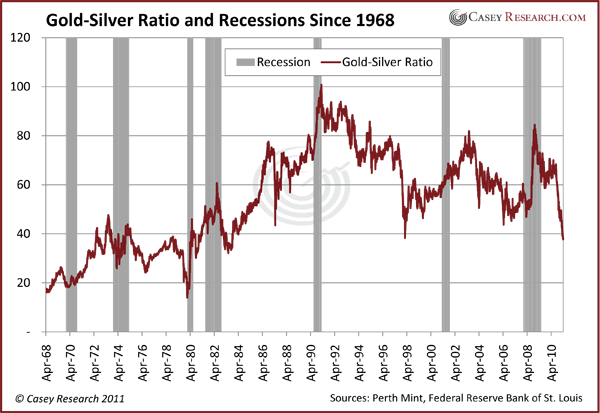
We believe that the measures taken by the current administration to battle the recession are largely counterproductive, temporary, and will be unable to prevent the onset of another major economic decline. It is difficult to judge when the turmoil might start, but the odds of it happening soon get higher as the levels of government debt increase and the dollar is debased. When push comes to shove, the GSR can react quickly and create a fluctuation of an unpredictable magnitude.
In times of recession, as we discussed above, gold and silver behave in a quite different manner. Have a look at the following charts.
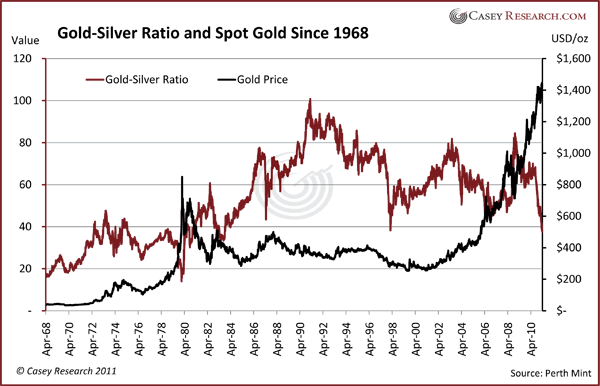
Note that it is not quite statistically sound to plot a ratio against one of its components, but for the purpose of illustration we find it quite useful.
As you can see, in 1980 gold and silver both peaked on a historically low GSR. This may imply that a low ratio can take place not only when silver appreciates faster than gold (as it did in 2010 and so far in 2011), but also when fundamental and speculative conditions influence both metals. Of course, the 1980 silver peak happened while the infamous Hunt brothers were massively accumulating the metal.
Conventional opinion attributes silver’s rise to the Hunts, but we are skeptical. It cannot be determined to what degree the metal would have otherwise risen absent the Hunts in the market. In any case, attempts to influence markets are nothing new – today, major investment banks are accused of manipulating the silver market by holding huge short positions that cause artificial price suppression.
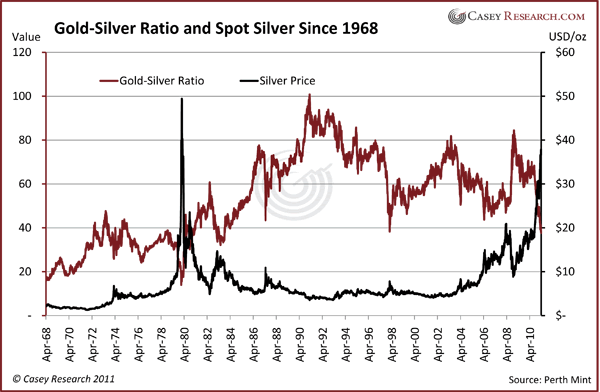
Returning to the charts and how gold and silver behaved in the last recession, we can see that silver moved counter to the GSR while gold moved in a mixed, sideways pattern. Because of this, many see a lot of upside potential for silver, but we should not forget that silver is the denominator in the ratio. So absent strong fluctuations in gold – and gold was on an ascent since the beginning of 2009 – the GSR would to some extent simply mirror silver price movements.
The silver price was also influenced by hopes that the global economy is reviving and that industrial demand is going to last. In 2010, silver gained more than 80% while gold added less than 30%. The difference resulted in the GSR falling throughout 2010. Will that performance be repeated? We cannot say. Speculators should remember that the GSR is merely a ratio of two prices often driven by different forces. It has limited, if any, predictive power.
With that in mind, we will finish by juxtaposing the ratio against the Toronto Venture Exchange (TSX-V) index, and it reveals an interesting picture: it seems that the TSX-V has been negatively correlated with the ratio for the last ten years. Again, statistically it’s arguable if a ratio should be compared to an index, but looking at various combinations of time series, and the stunning correlation, we couldn’t help ourselves.
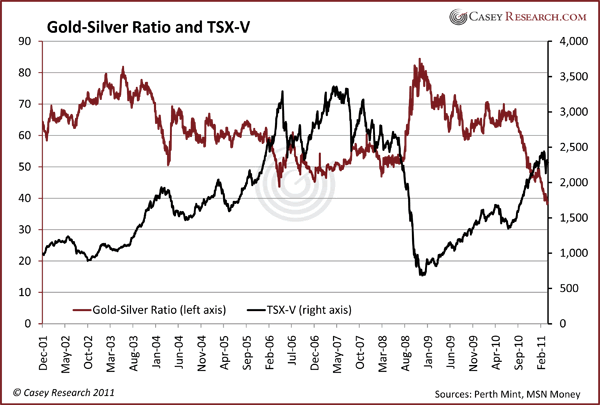
It would be easy to conclude that there is a strong – and negative – correlation between the index and the ratio. However, this correlation does not provide any sort of guidance on whether the metals themselves look expensive or not, or where mining stocks are headed. An interesting image, that’s all it is.
Conclusion
The gold-silver ratio attracts a lot of attention nowadays, but it is not a reliable tool in an investor’s toolbox, and we don’t think it can predict future price movements. But the reality is that nothing does. Those who look at GSR charts, including ours above, should not forget to analyze all the fundamentals behind the price movements of both gold and silver. We advise you to be extremely cautious and not get caught in the trap of believing that a single number or ratio, or a set of them, can provide you with a crystal ball.
Identifying an opportunity for future profit based on facts and a reasonable amount of risk is another thing. This is what we do day in and day out – just not based on the GSR.
Ed. Note: Since this article was first drafted, there has been a significant correction in gold and silver that has affected the GSR. As of May 12, it stands at 45.8, having increased as predicted in this article.
[Developed by Doug Casey, the “8Ps of Resource Stock Evaluation” – People, Property, Price, Politics, Promotion, Paper, Phinancing, and Push – are the Casey Metals Team’s best tool for discovering small-cap mining companies with outstanding profit potential. And with great success: in 2010, the International Speculator portfolio beat the S&P 500 by an incredible 8.4 times. Read more about the “gold nuggets” Senior Metals Analyst Louis James keeps finding in flyblown corners of the world… and how you can cash in on them.]
© 2011 Copyright Casey Research - All Rights Reserved
Disclaimer: The above is a matter of opinion provided for general information purposes only and is not intended as investment advice. Information and analysis above are derived from sources and utilising methods believed to be reliable, but we cannot accept responsibility for any losses you may incur as a result of this analysis. Individuals should consult with their personal financial advisors.
© 2005-2022 http://www.MarketOracle.co.uk - The Market Oracle is a FREE Daily Financial Markets Analysis & Forecasting online publication.