Gold and Silver Fibonacci and Delta Time Charts Analysis
Commodities / Gold and Silver 2011 Jun 25, 2011 - 06:23 AM GMTBy: Alistair_Gilbert
 Earlier this year there was much fanfare that Gold had closed out 2010 had higher levels than the previous year for 10 consecutive years and that this was the first time in history that any commodity had done this.
Without a doubt, it has been an exceptional performance, and whilst there have been plenty of reasons for its sustained performance to date, I believe that both the fundamentals and the chart are telling us that it is all about to change. On the fundamentals, interest rates have been on 100 year lows in order to prop up the failing banks from the 2008 crash.
That was done at the same time as the FED was pumping bucket loads of free cash into the banks by expanding its own balance sheet with QEs 1 and 2. The purpose was to allow the banks to make massive profits to prop up their tattered balance sheets. Virtually every bank in the western world was insolvent. The banks had spent years making imprudent loans to companies and individuals (particularly commercial and retail mortgages) so were not inclined to take the risk of lending again, so they have pumped the monies into bonds, equities and commodities.
This has had a devastating effect on the US Dollar falling by 40% in the last 10 years and of which half was in the last 2 years. The trough is now being removed on 30th June, which explains why the Banking Index (BKX) has dropped by 20% in the last few months. With the FED unable to buy its own Treasuries, and no-one else interested, the market will demand the raising of interest rates to a level that will attract buyers. Greece is having to pay 28.5% interest per annum to attract buyers for its 2 year bonds. How much will the U.S. have to pay? Probably not so much, but its debts are way out of control. The U.S. has issued more debt in the last 2 years than in the whole of its history. For it to be repaid, there are only two routes, default or hyperinflation.
So how will these scenarios affect Gold? In the event of default we will have a scenario similar to when Lehman collapsed except multiplied by a thousand. Banks and companies will be scrambling to unwind loans which will mean that all assets will be sold to raise US Dollars to repay those loans. This will have a dramatic effect on boosting the US Dollar at a time when those assets are being sold and as all commodities are priced in US Dollars they will plunge. This in turn will have a massive deflationary effect and as Helicopter Ben has stated and restated that he is an expert on the deflation of the 1930s and that it will not happen on his watch, then this is the least likely scenario.
The alternative is hyperinflation. This would come about through an eventual QE3 scenario. I do not think that QE3 will come immediately as the FED needs to cause a lot of pain first before Congress will contemplate allowing the FED to print any more money. So, through withdrawing the trough they will engineer an asset collapse (thus strengthening the dollar) for a period (maybe six months) then when they get QE3 approved, the dollar will collapse and the FED will have to offer interest rates of 20% plus to attract buyers. When interest rates are high, Gold does not do well because it does not pay interest so institutions do not want to speculate by borrowing money to invest in Gold and they are more interested in receiving high levels of interest guaranteed by government.
More recently, I have seen many bullish reports suggesting that Gold will be $2,000 or even $2,500 by the end of this year. I do not see that. Let us now not speculate on fundamentals and examine the technicals by
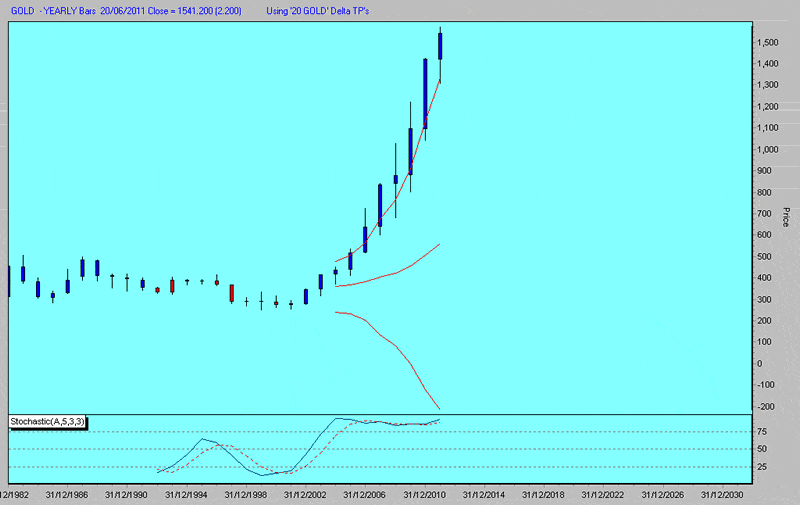
seeing what the charts are telling us. This is an annual chart of Gold. Note how the whole of this year’s candle is outside the upper Bollinger Band. It never continues like that. Normally when a candle pops its head above the upper Bollinger Band, that is a “continuation trend” as we see exemplified in this chart. When the whole candle is outside the upper Bollinger Band it needs to revert to norm and that is most often through a sharp correction as we saw in Silver last month.
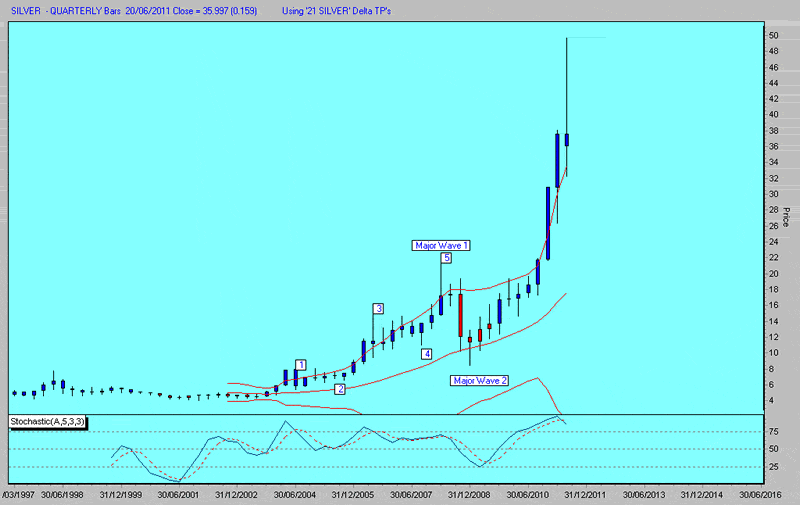
Look below at the quarterly chart of Silver. It opened the quarter at $37.62 went shooting up to nearly $50, pulled back 35% in four days to $32 and has settled around $35 for the moment. The important thing to note is how the whole candle is outside the upper Bollinger Band, as with the annual Gold chart, and is now starting to correct back inside the Bands. Note also how the lower Bollinger Band has sharply corrected down whilst the upper Band remains vertical. This happened ahead of the correction warning us of a big move ahead. Note also how the Stochastic hit the ceiling and has now moved down through its Moving Average.
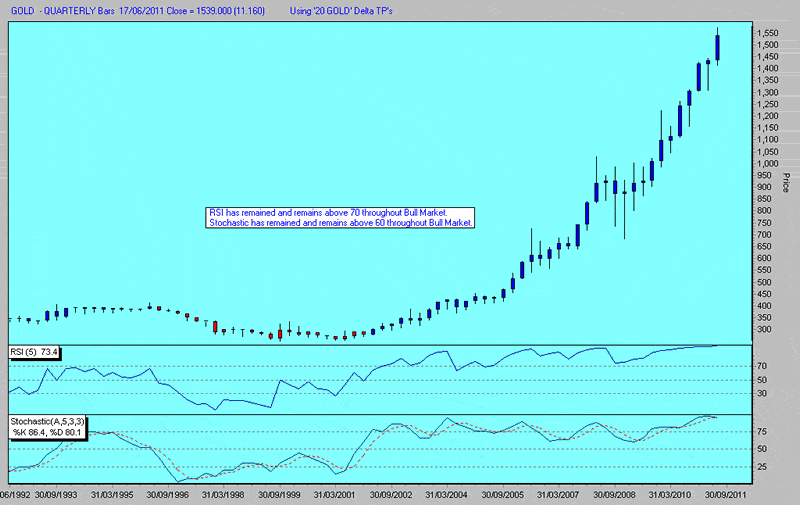
Moving on to the quarterly DELTA Gold chart, it shows that despite the sharp pullback in 2008, the candles remained blue (bullish) throughout, since 2001. Whilst the RSI has remained above 70, it is currently reading an extreme 98.5 and the Stochastic is rolling over through its Moving Average from 97.5 which warns us that the upside is limited without having a healthy correction first.
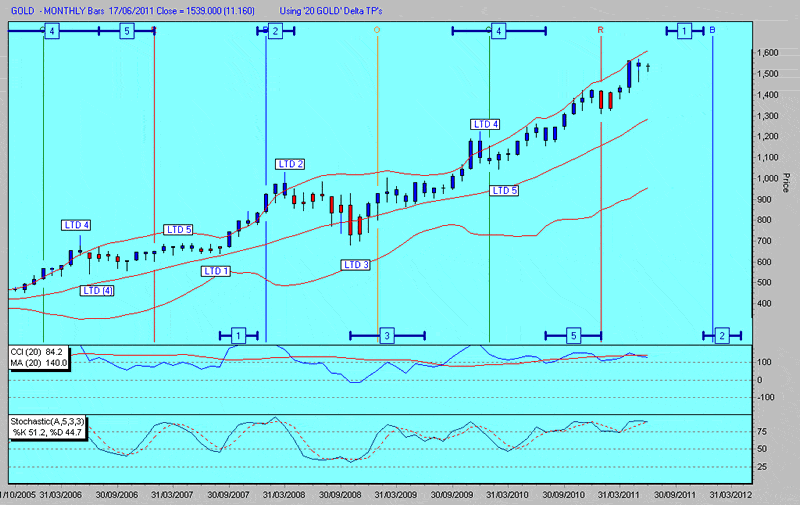
The monthly DELTA chart shows candles firmly in upper Bollinger Band. Whilst CCI has moved below Moving Average, it has not broken below 100 yet, so no SELL signal. Stochastic rolling over, but has not dropped below 75 yet, so no SELL signal on long term chart.
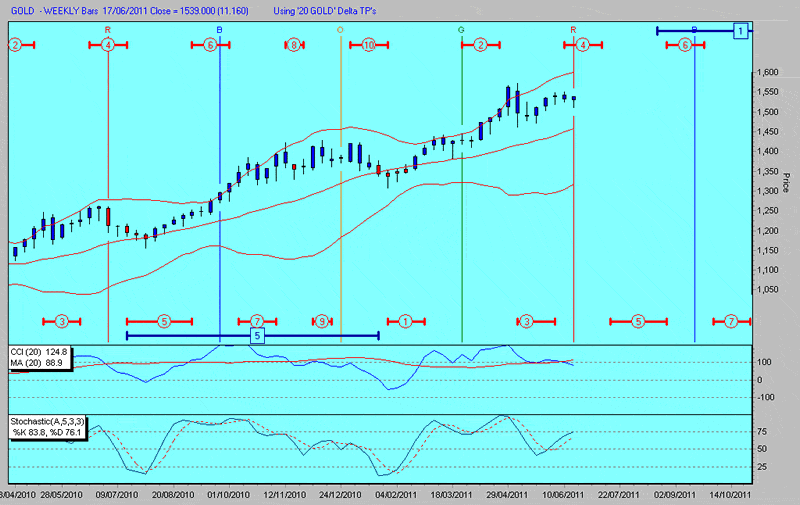
On the medium-term weekly DELTA chart the CCI has moved down through the Moving Average and dropped below 100, giving a SELL signal. Stochastic has not rolled over yet, so awaiting confirmation. MTD 4 high due now, so looking for $1553 to be marginally beaten.
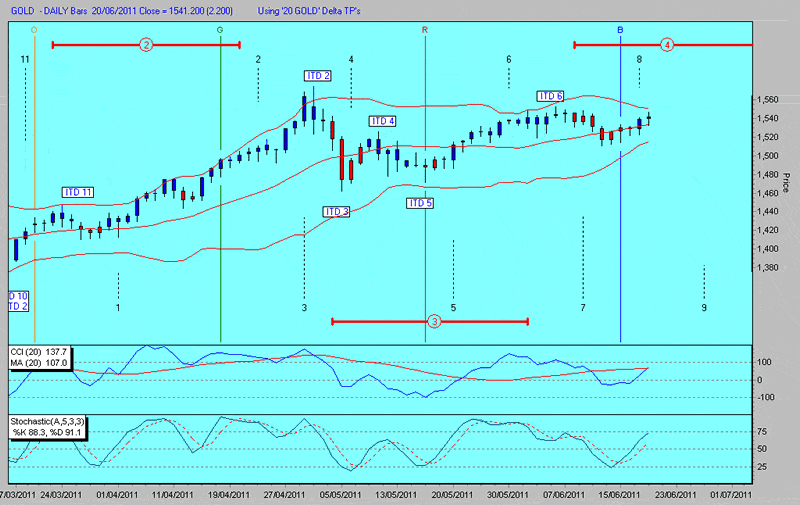
The daily DELTA chart shows the Bollinger Bands starting to pinch together in anticipation of a big move. ITD 8 is the third high in a row since the MTD 3 low, so I am expecting a higher high than ITD 6 which was $1553.42 and it will bring in MTD 4 high. Stochastic and CCI remain short-term bullish.
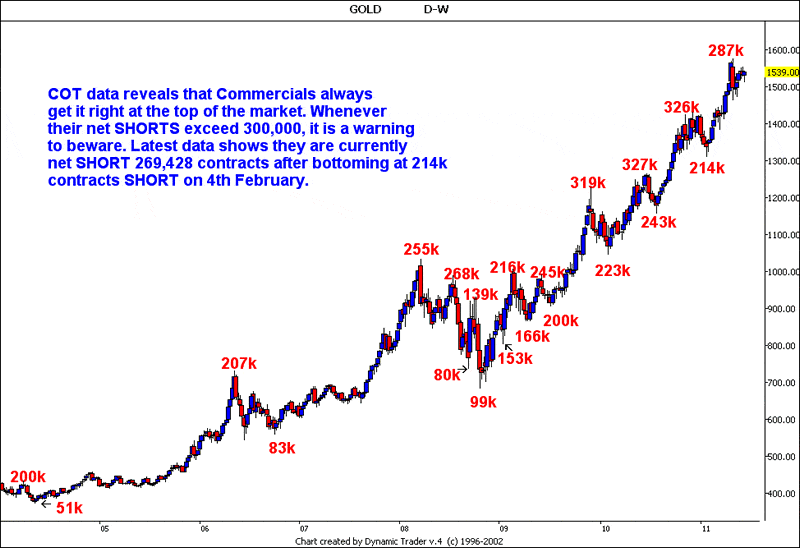
We have not examined the COT data for a while, and it is interesting to note that for the first time in 10 years a higher high in PRICE has brought in a smaller SHORT position from the Commercial Traders, meaning that they have been reducing their SHORTS on the way up. Are they expecting higher prices or is it pressure from the CFTC?
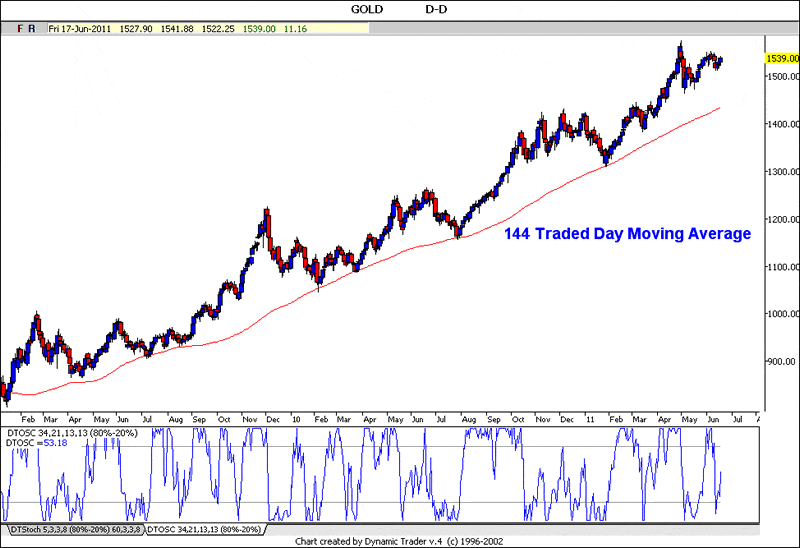
I am showing this chart again because the Fibonacci 144 day Moving Average has proved itself as major support since the October 2008 lows. Whilst Gold has so far suffered a very minor correction compared to Silver, it shows that if this Bull market is to remain intact, it should not pull back any further than about $1,450 in the coming weeks, but note DT Oscillator still bullish.
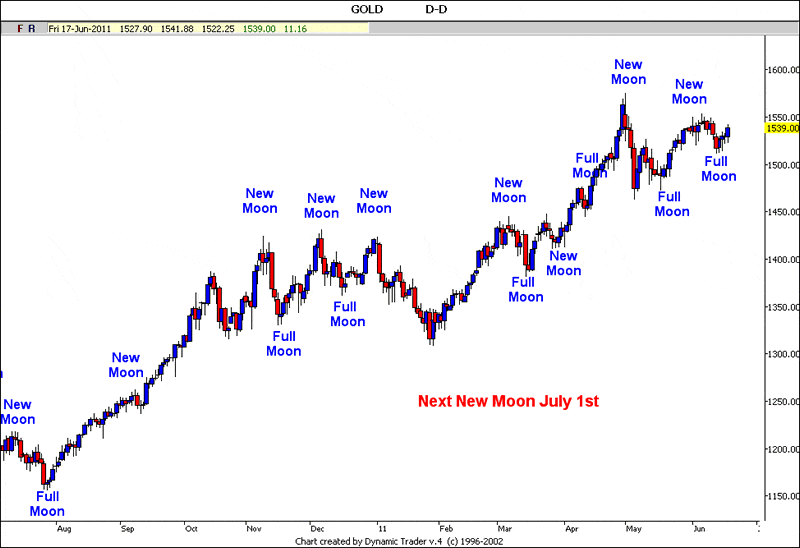
One other area that we have been following for a number of years is how highs and lows are brought in by New and Full Moons. As you can see, mainly the New Moon brings in highs and the Full Moon lows. At the end of March we had an inversion and the New Moon brought in a low. The next New Moon is due 1st July and DELTA is expecting it to be a low.
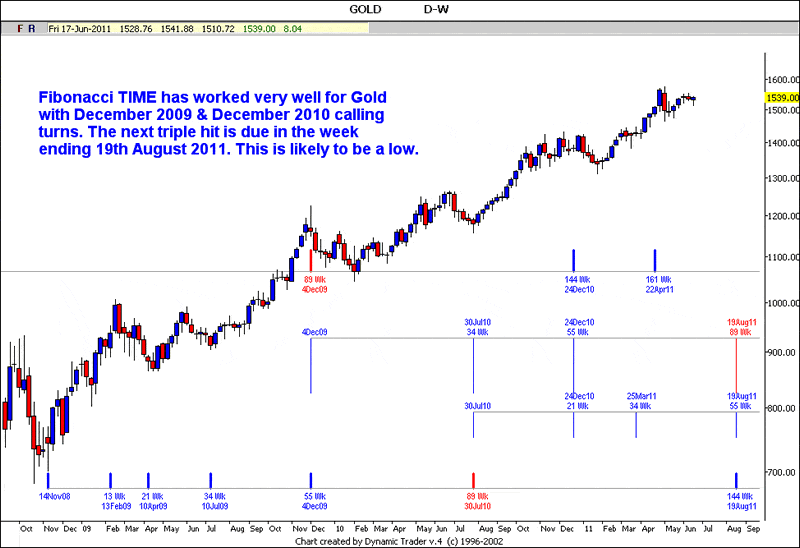
My final DT chart is my Fibonacci TIME chart which has worked well with double and triple TIME hits in the past. The next due date is a triple hit for the week ending 19th August which I expect to be a significant low and ties in with the seasonal lows that normally arrive around that time.
By Alistair Gilbert
ALISTAIR GILBERT has worked in the markets for over 30 years. He has worked as an institutional research analyst for a firm of stockbrokers where he got his grounding as a technical analyst. He has also worked as branch manager of a firm of stockbrokers managing private client portfolios and as a fund manager for a leading merchant bank. Alistair was also Managing Director of a Swiss Fund Management group with over $1 billion under management and developed the business extensively in the Middle East.
Alistair has now returned to his native England where he now specialises in TIME and PRICE analysis utilising Elliott Wave, DELTA and a range of technical indicators. I can be contacted via alistair@alistairgilbert.com
Disclaimer: The ideas expressed in this Report are the thoughts of Alistair Gilbert and represent part of the intricate process that he goes through before arriving at a trading decision and as such are like a trading diary. Alistair Gilbert is not an authorised investment adviser and as such none of his statements should be construed as investment advice. The value of investments can go up as well as down and trading is very high risk. Readers are advised to consult with their own investment advisers who may be better qualified to offer a trading strategy based on your own individual circumstances.
Alistair Gilbert Archive |
© 2005-2022 http://www.MarketOracle.co.uk - The Market Oracle is a FREE Daily Financial Markets Analysis & Forecasting online publication.


