


U.S. Dollar Speaks While Gold, Silver, Oil and S&P500 Listen
Stock-Markets / Financial Markets 2011 Jul 01, 2011 - 05:26 AM GMTBy: J_W_Jones

 Investors and traders alike were watching the action unfold across the pond earlier this week. It was seemingly a foregone conclusion that Greece would get the bailout they desired in order to prevent a potentially catastrophic default. The Greek default situation increased volatility in financial markets around the world. In addition to the Greek dilemma, the end of the 2nd quarter and the customary window dressing by institutional money managers only heightened the volatile situation.
For the past week or so I have been sitting in cash, watching the price action and waiting for setups that have defined risk and solid rewards. With the heightened volatility I did not want to get involved because a trade in the wrong direction would wreak havoc with my portfolio. As this week evolved, the validity of those concerns was unquestionable.
Commodity investors have faced some tough price action recently as gold, silver, and oil have traded significantly lower quickly. Now that we have witnessed some heavy selling pressure set in particularly in the silver and oil markets investors want to know where price is heading in the short term.
U.S. Dollar Index
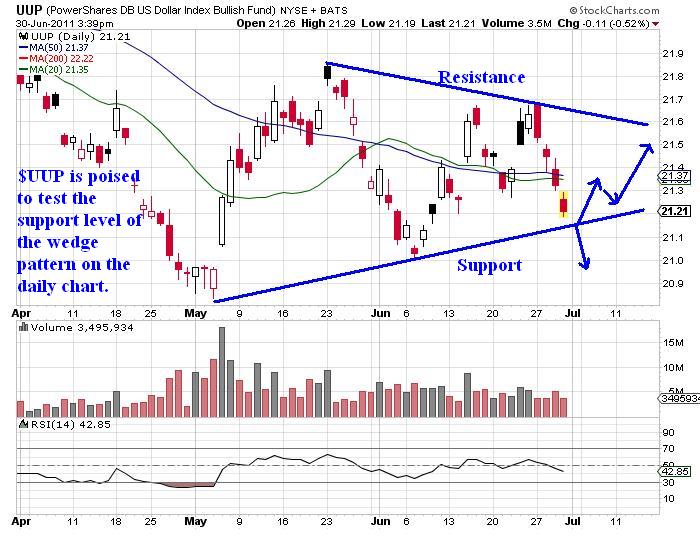
For the past several months I have been monitoring the U.S. Dollar Index futures in order to gauge the price action in commodities and the S&P 500. The Dollar is currently trading at a key support level and the price action in coming days will be telling. While I do not trade solely on analysis pertaining to the Dollar, I do look for setups where an underlying is dramatically impacted by its price movements.
When the planets align, I will take a trade with a directional bias that is supported by the price action in both the underlying that I'm trading and the U.S. Dollar's price action as well. At this point in time, the U.S. Dollar Index is trading right at a key support level marked by the 20 & 50 period moving averages as well a recent low. The daily chart of the Powershares U.S. Dollar Index Bullish Fund $UUP is shown below:
UUP Daily Chart
Gold & Silver
The recent bounce higher in the U.S. Dollar has been a factor in pushing gold, silver, oil, & the S&P 500 lower. Silver and oil were impacted in the harshest manner, but all four asset classes were negatively impacted. Precious metals tend to weaken during the summer and then pick back up in the fall. However, the selloff in silver the past few months has been breathtaking. For precious metals bulls who entered silver late in the rally the only outcomes were dismal. Late comers to the silver bull market were either stopped out or are currently experiencing significant pain.
While I remain a longer term bull as it relates to precious metals, in the short term I expect lower prices to continue. A major factor in my analysis stems from a longer term standpoint; the U.S. Dollar has likely put in an intermediate to long term low. There are a variety of reasons as to why, but suffice it say that from a market cycle standpoint the Dollar has likely achieved a major low and a reflex rally is likely.
Issues in the Eurozone are far from over and as time passes I expect the impact of fiscal issues rising in countries like Ireland, Portugal, and Spain to have a major impact on U.S. Dollar prices. If the sovereign fiscal issues in Europe result in a default or even a more mild technical default, the impact will likely be bullish for the U.S. Dollar.
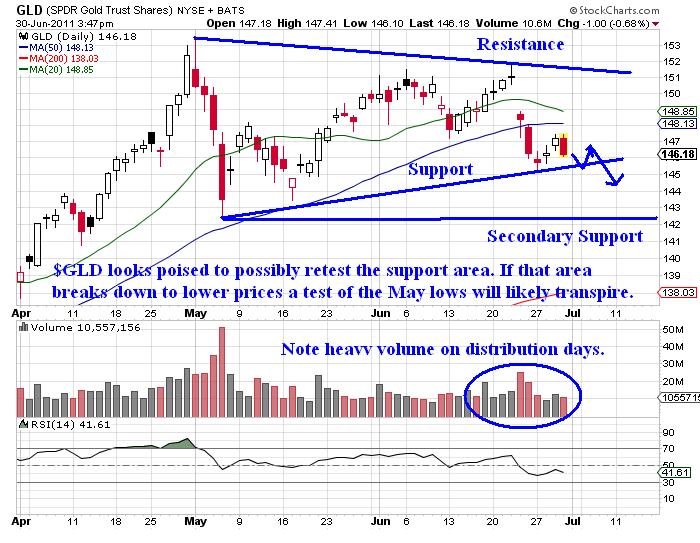
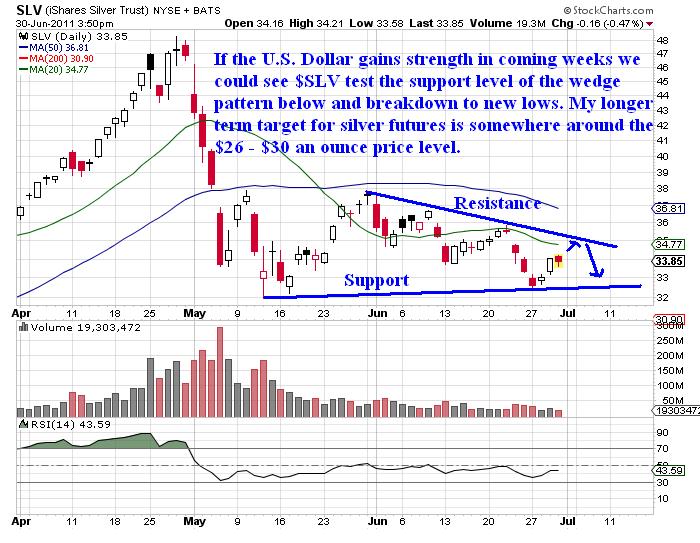
The daily chart of the SPDR Gold TR ETF $GLD and the Ishares Silver Trust $SLV shown below illustrate the key areas which may be tested before the bull market in precious metals continues:
GLD Daily Chart
SLV Daily Chart
I am of the opinion that if precious metals investors are patient an outstanding buying opportunity will present itself in both gold and silver in weeks ahead. Looking at the daily chart of the two shiny metals and identifying key levels that make sense to acquire positions is important in the trade planning process.
I like to have a trading plan in place should my expectations unfold because it removes emotion from my trading. Planning a trade and trading a plan are extremely helpful when investing in volatile markets like silver and gold. In the longer term, I continue to believe that gold and silver will shine, but in the short term more price weakness may be ahead.
Crude Oil
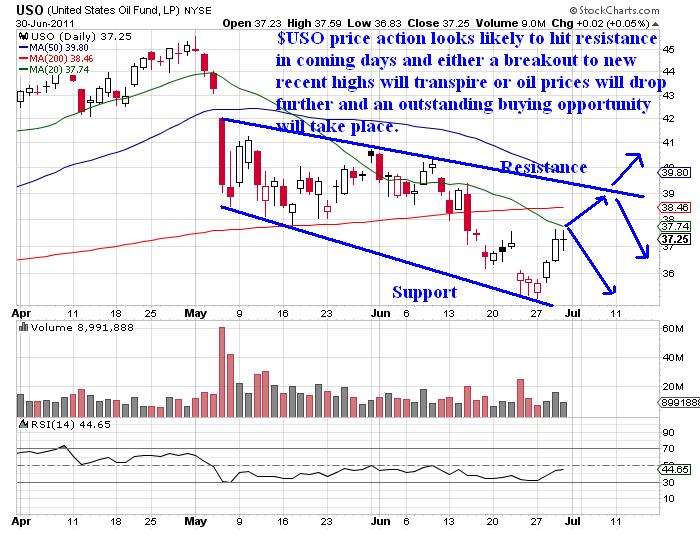
I am a long term gold and silver bull, but the single asset class that I am the most bullish about is energy. Oil prices in the long term have only one direction to go - HIGHER. I realize that a slowdown in the economy will put downward pressure on oil prices, but as the world's demand for oil increases and the supply level plateaus or decreases oil prices will be forced higher. If the Dollar does rally as I expect, oil prices would likely be negatively impacted and a buying opportunity would be forged.
The daily chart of the United States Oil Fund ETF $USO is shown below with my future price expectations and current key price levels illustrated:
Oil Daily Chart
S&P 500
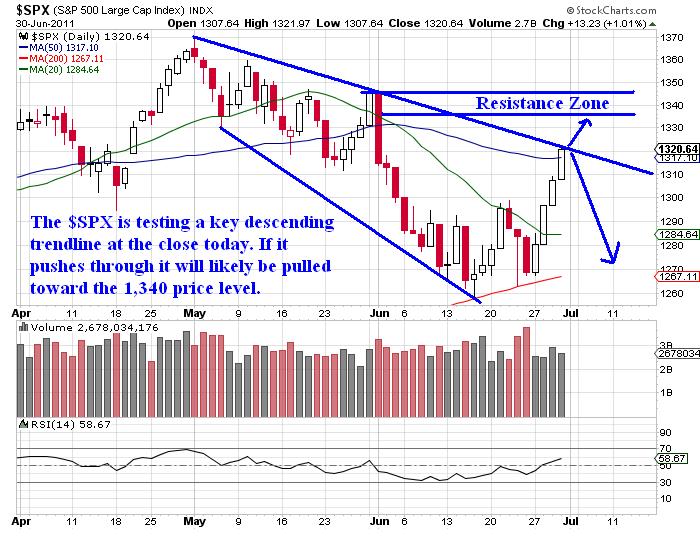
The S&P 500 is in a very tricky spot for traders. Right now price action is testing the underbelly of a major descending trendline on the daily chart shown below:
SPX Daily Chart
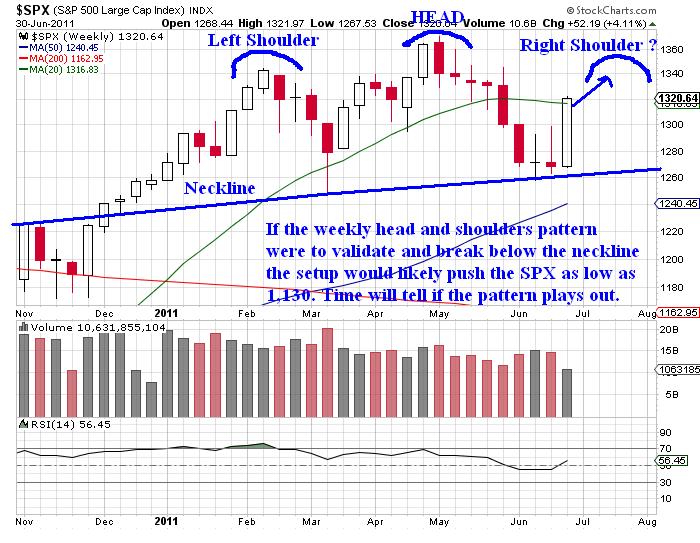
However, if we take a look at a weekly chart note the massive head and shoulders formation that many traders have totally missed. A rally to the S&P 500 1,340 price level would complete the pattern. While head and shoulders patterns have failed several times in recent history, this is a major head and shoulders pattern on the weekly chart which holds more credence than shorter time frames such as the hourly or even the daily charts. The weekly chart of SPX illustrates the head and shoulders pattern.
SPX Weekly Chart
In the short run I think the S&P 500 can work higher, but if I'm right about higher prices for the U.S. Dollar in the future I expect to see much lower prices in the S&P 500 in the intermediate term, particularly if the weekly head and shoulders pattern plays out. If the S&P 500 struggles to breakout above key resistance levels, I will be of the opinion that the bear may have stopped hibernating and an impending recession may be thrust upon us in short order. There are signs pointing in that direction, but right now it remains too early to call.
Conclusion
In closing, my analysis reveals that the U.S. Dollar is poised to push higher, particularly if current support holds. If the Dollar can push above key resistance levels overhead, I expect the resulting price action in gold, silver, oil, & the S&P 500 to be dismal for the bulls.
I will be watching the Dollar closely looking for clues about price action. If I'm wrong and the Dollar breaks to new lows I would expect a massive rally in precious metals, energy, and domestic equities. With the recent price action that we have seen in the U.S. Dollar, I find it much more likely that the U.S. Dollar extends higher in coming weeks. As usual, time will tell.
If you would like to be informed several times per week on SP 500, Volatility Index, Gold, and Silver intermediate direction and options trade alerts… take a look at http://www.optionstradingsignals.com/specials/index.php today for a 24 hour 66% off coupon, and/or sign up for our occasional free updates.
J.W. Jones is an independent options trader using multiple forms of analysis to guide his option trading strategies. Jones has an extensive background in portfolio analysis and analytics as well as risk analysis. J.W. strives to reach traders that are missing opportunities trading options and commits to writing content which is not only educational, but entertaining as well. Regular readers will develop the knowledge and skills to trade options competently over time. Jones focuses on writing spreads in situations where risk is clearly defined and high potential returns can be realized.
This article is intended solely for information purposes. The opinions are those of the author only. Please conduct further research and consult your financial advisor before making any investment/trading decision. No responsibility can be accepted for losses that may result as a consequence of trading on the basis of this analysis.
© 2005-2022 http://www.MarketOracle.co.uk - The Market Oracle is a FREE Daily Financial Markets Analysis & Forecasting online publication.