


Credit Market Ominous Similarities to 2007, Short Stock Indices
Stock-Markets / Stock Markets 2011 Jul 28, 2011 - 04:15 AM GMTBy: Tony_Pallotta

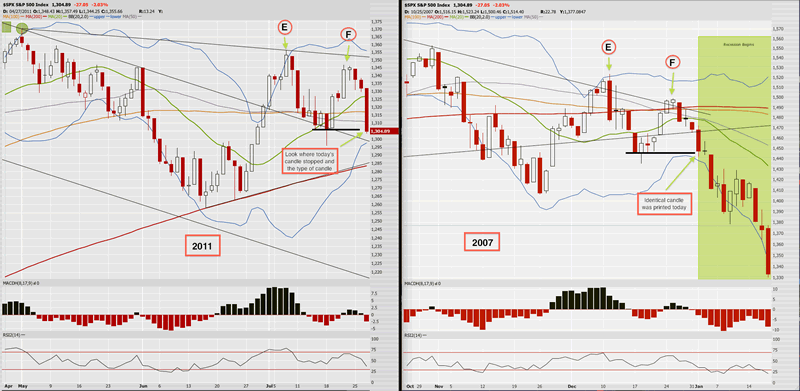
 Dramatic title I realize but look at the charts below and ask yourself if this is purely coincidence or something more telling. Regulars to this site have read posts comparing the current market to that of late 2007. From equities to credit markets to volatility and more the similarities across asset classes has been rather striking.
The basis for these comparisons was the belief that at major inflection points markets are more about psychology than they are technicals and or macro data. Since human nature never changes patterns will repeatedly play out as discussed by Jesse Livermore (the following is from a book discussing his trading beliefs).
"He observed that human emotions collectively had major impacts on the movement of stock prices and Markets in general, ultimately creating patterns that kept repeating."
Since late June these charts have continued to track very well. Most recently the final move to Point F and subsequent sell off has been eerily similar including the candlestick patterns as highlighted below.
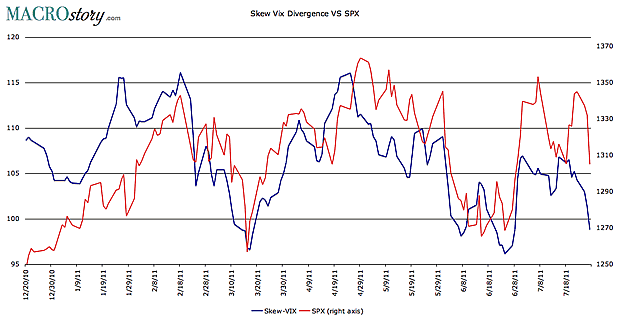
Next comes the sell signal. Notice the Skew Vix divergence below. The accuracy from a day to day basis is not 100% but the correlations are enough to point towards further selling. In fact I referenced this on Tuesday even while the ES futures were still flat.
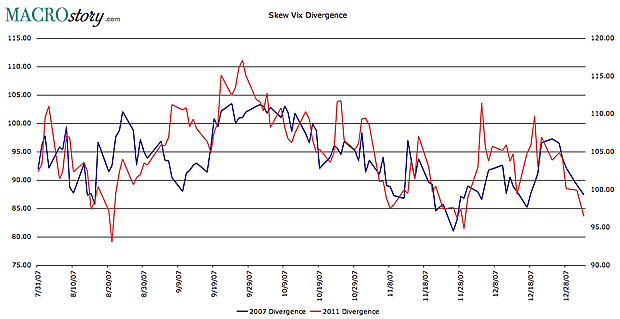
Lastly look at the correlation of the divergence (skew and vix) between the current market and that of late 2007. The basis for this chart was the belief that the divergence captures market psychology by understanding the desire to price in high risk events. Current market psychology in my view is playing out exactly the way it did in late 2007 as the great recession began and markets put in a significant move lower.
In essence of full disclosure below is my current trading portfolio. Please note this is not investment advice.
I am currently short SPX via long SPY puts for both August and September and long SPY August debit put spreads. I did sell some SPY August puts today to offset the September puts I bought earlier in the week. The result my position size is the same but I was able to manage risk by shifting to a future expiration for about the same price. In other words I have the same capital at risk but have an additional month of theta.
By Tony Pallotta
Bio: A Boston native, I now live in Denver, Colorado with my wife and two little girls. I trade for a living and primarily focus on options. I love selling theta and vega and taking the other side of a trade. I have a solid technical analysis background but much prefer the macro trade. Being able to combine both skills and an understanding of my "emotional capital" has helped me in my career.
© 2011 Copyright Tony Pallotta - Disclaimer: The above is a matter of opinion provided for general information purposes only and is not intended as investment advice. Information and analysis above are derived from sources and utilising methods believed to be reliable, but we cannot accept responsibility for any losses you may incur as a result of this analysis. Individuals should consult with their personal financial advisors.
© 2005-2022 http://www.MarketOracle.co.uk - The Market Oracle is a FREE Daily Financial Markets Analysis & Forecasting online publication.