


Will The Stocks Cyclical Bull Market Continue?
Stock-Markets / Stock Markets 2011 Aug 24, 2011 - 03:10 PM GMTBy: John_Hampson

 Time to revisit and update this table.
What are historically predictive indicators and measures currently saying?
Green = yes. Yellow = maybe. Red = No.
So, calculated as a rough probability, there is a two thirds chance of continuation. For that reason, and certain choice indicators still shining distinctly green, my current leaning is that we are not heading into a new bear market here but that this will turn out a severe correction. Now, technically, some key global stock indices are already in a bear market, such as the Dax, down 25%, however the leading economy stock indices, those of the USA, still have not breached the 20% rule of thumb. But this rule aside, clearly what we're trying to get at is are we to see many months of a declining market ahead or a turn back up soon?
So, starting from the top of the table: treasury yields/curve and interest rates may be warped by the Fed's actions and therefore not the reliable predictor that they historically have been. That said, the S&P dividend yield exceeds 10 year treasury yields, and neglibile interest rates encourages money out of cash and into dividend-yielding assets. That limits the likelihood of a steady flow of money out of stocks and into cash or bonds. Corporates are in good health too.
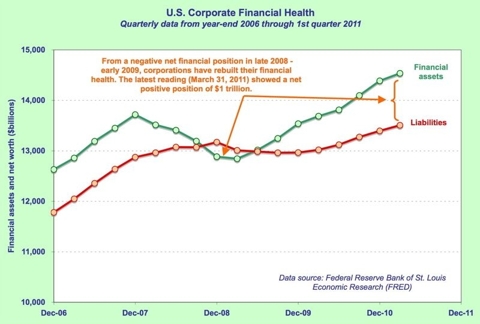
Source: Fed St Louis / John Tobey
Money supply is looking particularly positive.
Source: Shadowstats
Since QE2 ended we have actually seen an acceleration in the core money supply measures. Money velocity remains unimpressive but still positive and stable. Of course, if velocity accelerated together with accelerating money supply, we would be heading for severe inflation. So overall, the picture is healthy.
Solar cycles predict growth and inflation into the solar peak of 2013. We have not experienced a US recession in the run up to a solar peak in the last 80 years.
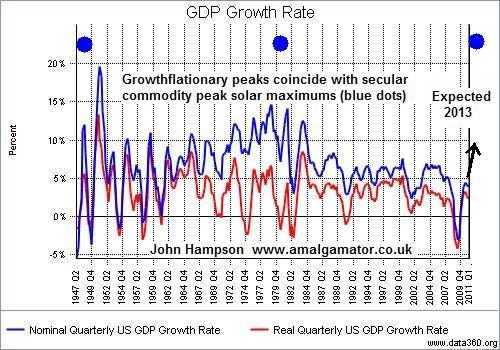
Underlying Source: Data360
US banks have increased lending this year and consumers have been borrowing more too. Increased credit should inspire such growthflation, subject to positive feedback looping.
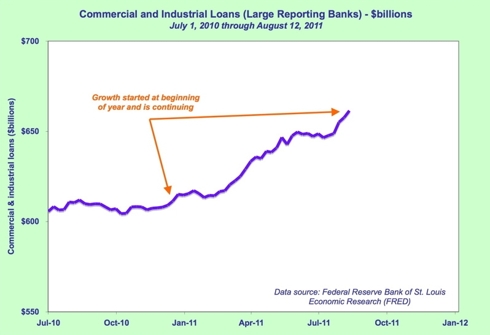
Source: Fed St Louis / John Tobey
Leading Indicators are mixed. ECRI leading indicators dipped just negative in the latest reading. Conference board indicators are still largely benign. The Chicago Fed National Activity Index came in at -0.06 for July, improved since June and some way from exceeding the -0.70 reading which has previously meant a forthcoming recession. The latest US PMI manufacturing reading was 50.9% - just growing still. This week's European and Chinese initial PMI readings came in above expectations but just negative at 49.7 and 49.8%. In short, the situation is fragile, and there is a risk of negative feedback looping, but as yet the sum situation is yellow not red.
The Bull Market Sustainability Index remains positive, but has weakened. Copper's chart looks technically like a correction in an ongoing uptrend, whereas the Kospi index looks technically broken. Stock market breadth did not diverge negatively on the S&P before the recent breakdown - a typical topping signal - but did so on the Nasdaq.
The Economic Surprises Index remains mired to the downside, with data still coming in significantly worse than economists' expectations. However, the index is at a level that has historically meant a reversal and has brought double digit returns for stocks in the following 12 months. Similarly, the Philly Fed has plunged to -30.7, which on the one hand is a sharp warning, but on the other hand has historically been the prelude to average gains of 23% over the next 12 months in the stock index.
The latest earnings season was one of the weaker quarters since the last recession, but beat Q1 2011. Corporate earnings are forecast to top out in 2012.
Seasonality remains weak over the summer months into the end of September, but by Presidential cycle we remain in a historic sweetspot. We can expect action from the US Government to improve the economy, the jobs and housing markets, in a bid for re-election, and CNBC have reported that Obama is to present a new programme of action in the first week of September. In association, the Fed is likely to make supportive action of some kind.
Bull market historic internals point to continuation into 2013, similar to solar cycles. The oil price has retreated sufficiently to take that lid of growth, and Japan is recovering following its tsunami-related economic shock. However, real US GDP year on year has slipped below 2%, which has historically been the prelude to a recession 10 out of 12 times.
In summary:
The odds still remain in favour of cyclical bull continuation, but the position is more fragile than last summer's soft patch, and there is the risk of negative feedback looping. Europe's debt issues remain at the fore and CDS values as at the end of yesterday for key Euro members remain in parabolic uptrends. There remains the possibility that the recent sharp stock market falls were foretelling a major event ahead, namely a European debt crunch point. However, I believe co-ordinated global policy response at this point in the cycle is still likely to be effective.
This chart captures the summary well:
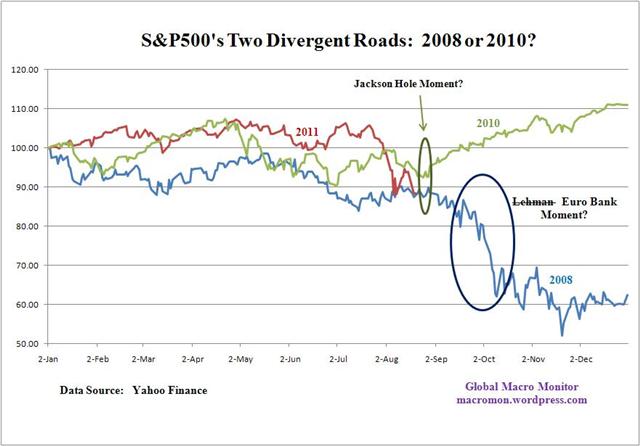
Source: Macromon / Big Picture
John Hampson, UK / Self-taught full-time trading at the global macro level / Future Studies www.amalgamator.co.uk / Forecasting By Amalgamation.
© 2011 Copyright John Hampson - All Rights Reserved Disclaimer: The above is a matter of opinion provided for general information purposes only and is not intended as investment advice. Information and analysis above are derived from sources and utilising methods believed to be reliable, but we cannot accept responsibility for any losses you may incur as a result of this analysis. Individuals should consult with their personal financial advisors.
© 2005-2022 http://www.MarketOracle.co.uk - The Market Oracle is a FREE Daily Financial Markets Analysis & Forecasting online publication.