


Gold, Stock Market Key Inflection Points
Stock-Markets / Financial Markets 2011 Aug 28, 2011 - 09:22 AM GMT

 Another week, another crazy set of moves, which I am sure are causing issues for some traders, although one thing that is working and working well is our areas, having key support and resistance areas sure does help trading these markets.
Gold
I thought I would start off 1st by doing something different and talk about something which I am sure most are looking for answers to and that's gold.
Has gold topped or put in some sort of high?, whilst my work is about probabilities based of wave structure, I also have recognized a bull market when I saw one, as some Elliotticians have been calling the "crash of doom" of gold for a long time and failing to acknowledge the simplest of technical analysis and that of a simple trend going from the bottom left corner to the top right corner of your screens.
You don't need to have any Elliott wave counts to know that gold has been in a bull market since the lows made in 1999.
So the question which I am sure is on everyone lips is, has gold topped and about to see a substantial correction?
The concept of Elliott wave analysis is that there is a 5 wave move in a trend then a correction of 3 waves.
Looking at the Bull Run there appears to be a very substantial case that we could have a 5 wave rally completed.
The difference between previous corrections and now is that we have seen some substantial evidence to support that a top could be in place or on a new high.
Forget Elliott wave for a second, in fact imagine that you have no experience of the markets and you simply were asked an opinion of the market.
What would be the 1st thing you noticed?
I would expect the answer would be that the angle or curve and the fact it's gone near exponential to the upside.
History shows that previous moves like this end badly as the last of the buyers, buys into the move only to see it collapse as there is simply not enough buyers to support the move as it accelerates higher.
Gold has simply moved higher like all market do, there is more buyers than sellers, if we were to see a reversal of that and buyers from late on the trend decide they are scared and don't want to hold on to the losses they have, you could see a very nasty reversal, similar to what you saw on silver a few weeks back.
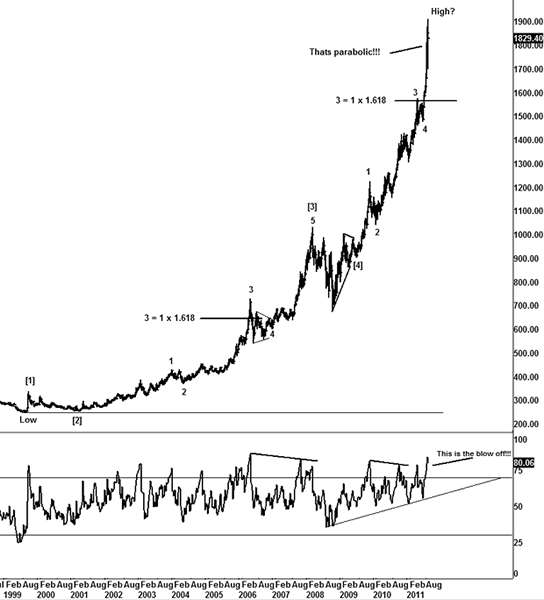
It's the same concept, like all parabolic type moves, they end nasty and I suspect this one will be no different, the $200 move we saw last week imo should be a warning sign to the bulls to start looking at an entry to potentially get out as you might see a substantial move lower and regret not taking profits.
Remember the $$$ is not your until it's banked in your account, it can vanish just as quickly as you made it.
Tops in markets tend to see these sorts of heavy reversals, then the bounce falls short of the previous high and then reverses and nervous bulls all try to get out of the market before the next trader, that's one thing that can never be second guessed, people's emotions play a huge part of the markets.
Some will argue that fundamentals play a larger part and especially on the gold market, but I will always say what I have always said, and that trends goes higher because there is simply more buyers and sellers, you don't need a reason.
Price tells you all you need to know, you don't fight a solid trend like we have seen unless it starts to show cracks, I believe we have we have seen such a crack last week in gold.
I could be totally wrong about gold and this goes to $5000, but if I am right and a peak is near then the bulls might live to regret holding on for extra pennies when the risk is not worth the extra gains, unless you truly believe that gold is going straight to $5000 from here or you are prepared to risk seeing potentially 20-40% lost.
When parabolic type moves reverse, they don't hang about as the flood of sell orders hits the market and there is a lack of support as the sellers outweigh the buyers, there is a lot of buyers from lower levels that have substantial profits, and if those sell stops get hit, that can cause a barrage of sellers to force the market lower to the next load of sell stops, that's simply how the market works, fundamentals don't matter when you have a rush of sellers looking to get out.
Looking at the wave count, the recent move I suspect constituents to what us Elliotticians call a blow off top as a 5th wave, commodities tend to have this characteristic for a final 5th wave. Whereas stocks tend to have a larger 3rd wave in a 5 wave sequence, commodities tend to see a larger 5th wave, you saw that back in 2008 with oil, and look how that ended.
The last move on gold has gone into parabolic trajectories and imo bulls should be respecting history as when markets go like this you simply have to respect what history shows us as a guideline.
Now as I previous mentioned, when markets go like this they can run higher than most think, but there comes a point when you see the cracks and I suspect we saw such a crack last week.
I won't go in too detail too much with the near term ideas, as that is reversed for members, I have done a lot of work on gold this weekend and explain what I am looking for to members, we could have a decent trade setting up on the short side.
I will just say this, if you still long gold it might be an idea to take some profits off the table, watch the market very closely from here for a failure to make a new high, or just push to the previous high and a rejection, as a topping formation has these sorts of characterizes and humans never change, and they make the waves that us Elliotticians count.
US Stock markets
Lots of back and forth whipsaw and chop in the markets this week, enough to cause a lot of pain for traders, but these are the conditions I thrive on, as if the market moves like it has done, it makes my job easier to count waves.
The question needs to be asked did the market put in a truncation on the SPX and DOW, as most traders I suspect see the recent price action as a triangle for a 4th wave.
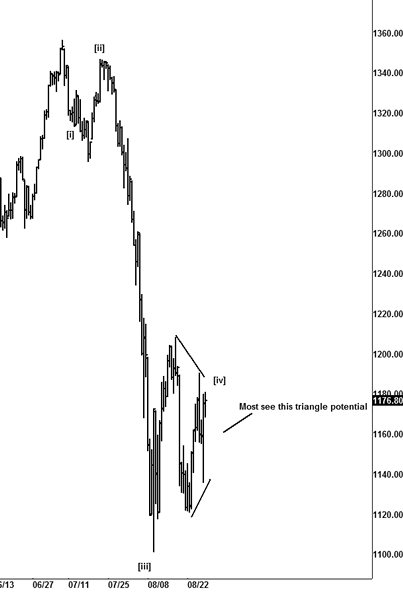
I actually think it's a great looking pattern, but one that also might be setting up a trap for the bears.
The key will be seeing early weakness in globex on Sunday/Mondays session and ideally a gap down needed, failure to see weakness could trigger a bigger problem for any shorts that are thinking the recent tape is that of a triangle.
Let me explain
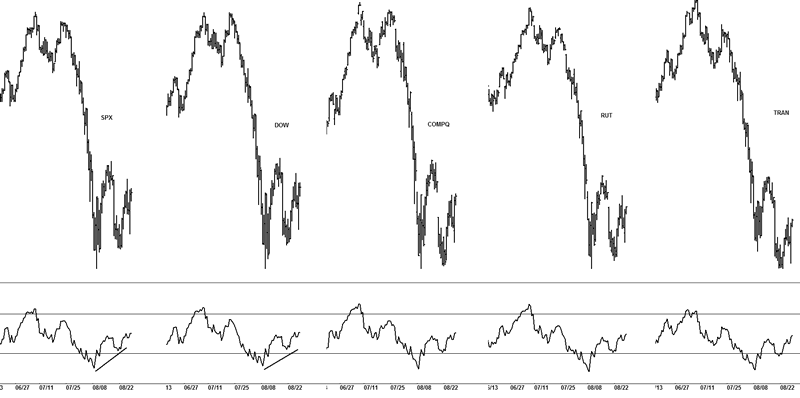
As you can see some of the other major markets did indeed get very close to the prior lows or breaks those swing lows, now if the SPX and DOW have truncated, the surprise will come on the upside and a low is in place already, it's just traders don't know it.
Hence why I think Sunday/Mondays globex session could have an effect of what the US markets do, if we see follow through to the moves off the Jackson Hole bounce, the bears could be in trouble fast, as the obvious pattern, may not be so obvious after all.
As the title of this article states we are at key inflection points with a lot of markets setup to make a sustainable move.
We are watching patterns and setups in the EUR/USD & GBP/USD pairs, silver and bonds that I suspect we offer great trades over the coming days, but we need to see a failure or follow through to help confirm the trend, let alone the other markets that we track and follow, copper and palladium appear to be at an interesting juncture.
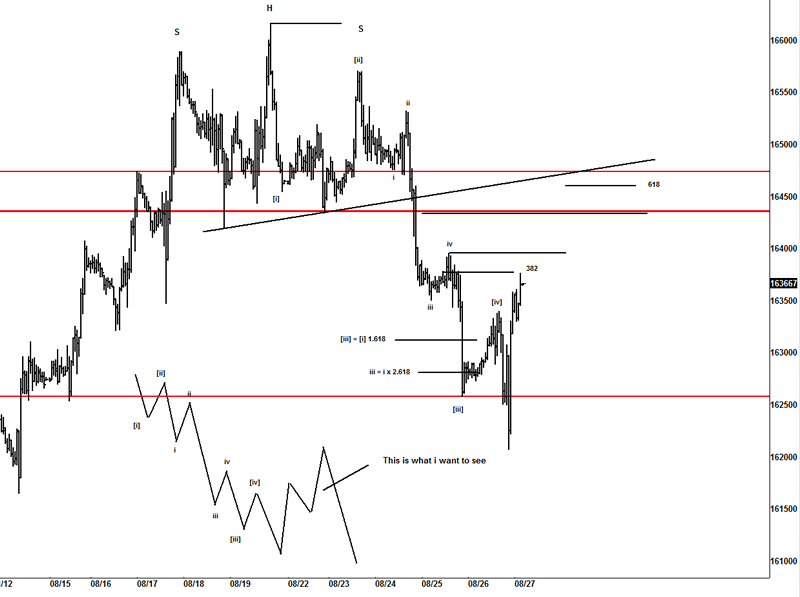
GBP/USD
Has this pair ended on a reversal H&S top pattern? No one can say for sure but one thing I do know is that from a short term perspective there is a great looking setup and one that could signal move downside if a rejection under 16430-16475.
Conclusion
Whilst there appears to be a very clean looking triangle idea on the stocks markets, which suggests a final 5th wave of a 5 wave sequence lower, then also might be a case for a truncated 5th wave as I wrote about last week, that with very large 3rd waves, a truncation for a 5th wave can be seen.
Gold and silver appear to be at potentially key junctures and we will know shortly about the ideas we are tracking, some of the FX pairs like GBP/USD and EUR/USD have some great looking setups that we are going to jump up when we can confirm price action and the ideas we are working, PA & HG, also offer a couple of nice looking setups to the metals traders, which also could be suggesting the metal complex is potentially setting up for a substantial move.
Until next time.
Have a profitable week ahead.
Until next time.
Have a profitable week ahead.
Click here to become a member
You can also follow us on twitter
What do we offer?
Short and long term analysis on US and European markets, various major FX pairs, commodities from Gold and silver to markets like natural gas.
Daily analysis on where I think the market is going with key support and resistance areas, we move and adjust as the market adjusts.
A chat room where members can discuss ideas with me or other members.
Members get to know who is moving the markets in the S&P pits*
*I have permission to post comments from the audio I hear from the S&P pits.
If you looking for quality analysis from someone that actually looks at multiple charts and works hard at providing members information to stay on the right side of the trends and making $$$, why not give the site a trial.
If any of the readers want to see this article in a PDF format.
Please send an e-mail to Enquires@wavepatterntraders.com
Please put in the header PDF, or make it known that you want to be added to the mailing list for any future articles.
Or if you have any questions about becoming a member, please use the email address above.
If you like what you see, or want to see more of my work, then please sign up for the 4 week trial.
This article is just a small portion of the markets I follow.
I cover many markets, from FX to US equities, right the way through to commodities.
If I have the data I am more than willing to offer requests to members.
Currently new members can sign up for a 4 week free trial to test drive the site, and see if my work can help in your trading and if it meets your requirements.
If you don't like what you see, then drop me an email within the 1st 4 weeks from when you join, and ask for a no questions refund.
You simply have nothing to lose.
By Jason Soni AKA Nouf
© 2011 Copyright Jason Soni AKA Nouf - All Rights Reserved
Disclaimer: The above is a matter of opinion provided for general information purposes only and is not intended as investment advice. Information and analysis above are derived from sources and utilising methods believed to be reliable, but we cannot accept responsibility for any losses you may incur as a result of this analysis. Individuals should consult with their personal financial advisors.
© 2005-2022 http://www.MarketOracle.co.uk - The Market Oracle is a FREE Daily Financial Markets Analysis & Forecasting online publication.