


Bull and Bear Market Cases for Gold, Silver and Stocks
Stock-Markets / Financial Markets 2011 Sep 25, 2011 - 11:50 AM GMTBy: Willem_Weytjens

 After gold and silver got hit hard last week, some of you probably wonder if that was the end of the 10 year+ bull market for precious metals.
In this article, we will describe both the Bull & Bear Cases for Gold, Silver and Stocks and we will also make some interesting comparisons.
Let’s start off with the Bull case for gold.
Gold hit the red resistance line, which also halted gold’s rise in 2006 and 2008. I drew Fibonacci Retracement levels from the Bottom in 2001 to the “Inflation Adjusted Alltime High” around $2,300. We can see that the Fibonacci Levels have done their job in the past. Will we hit the 61.80% level again (and this hit the orange line, which is right between the red resistance line and the green support line)? That level comes in at $1,516 and is the July 2011 breakout level.
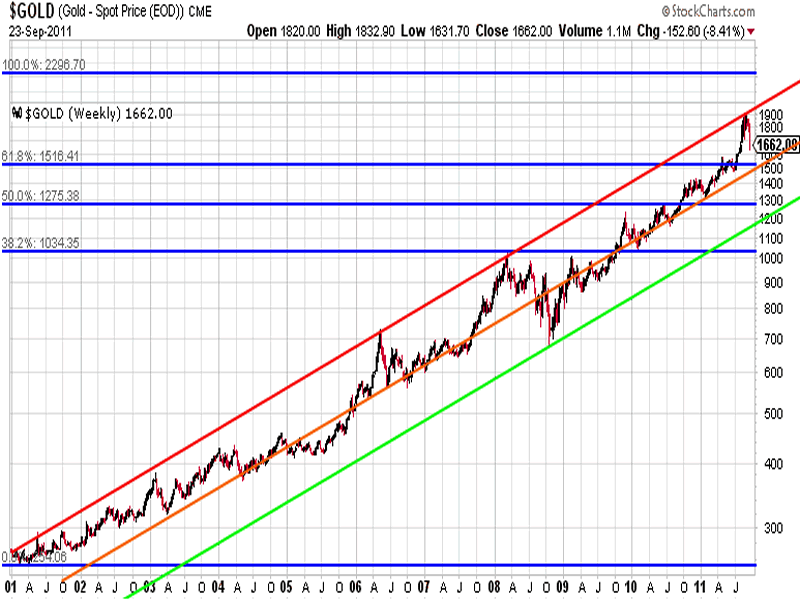
Chart courtesy stockcharts.com
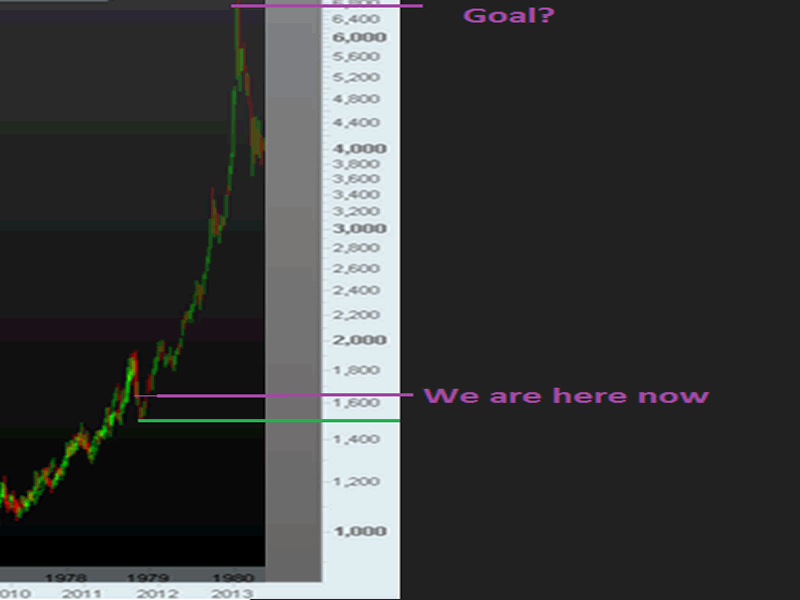
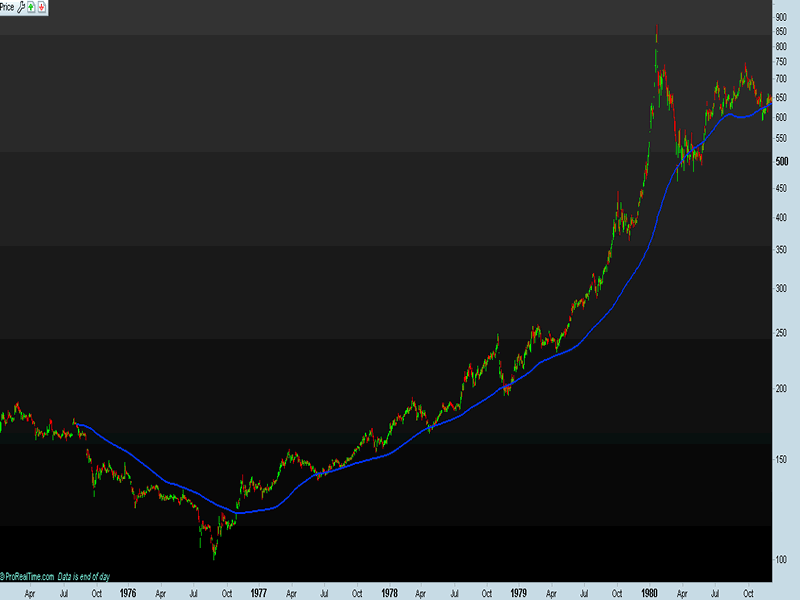
Notice that the comparison with 1979 also gives us support at or near the low $1,500′s.
When we reached oversold levels on the RSI combined with a BPGDM Index below 50, it often marked a bottom for gold:
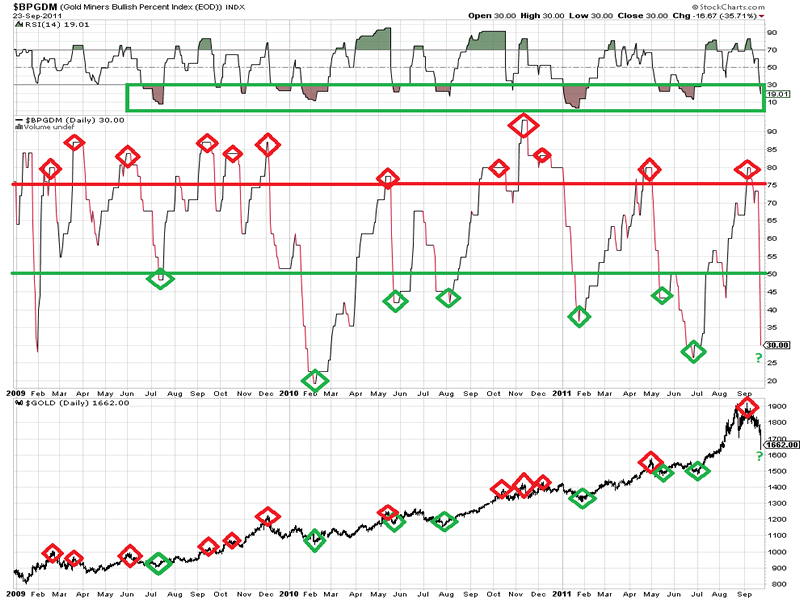
Chart courtesy stockcharts.com
When we look at the entire bull market of Gold since 2001, we can see that the 10 Months Exponential Moving Average was a good entry level. Right now, it is around $1,550. Price sometimes dipped slightly below this level, so once again, we might see the low $1,500′s.
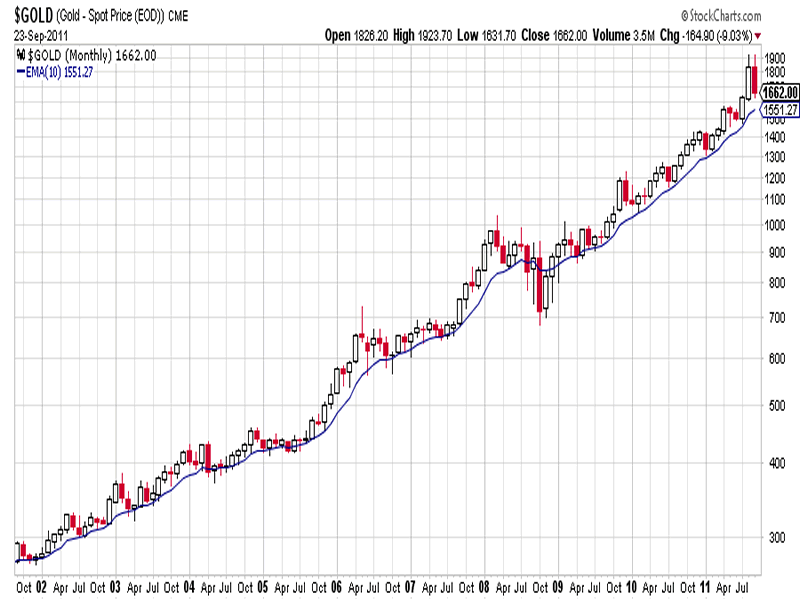
Chart courtesy stockcharts.com
When we look at the Weekly chart of Gold, we can see that the 30EMA has often supported the Gold Price.
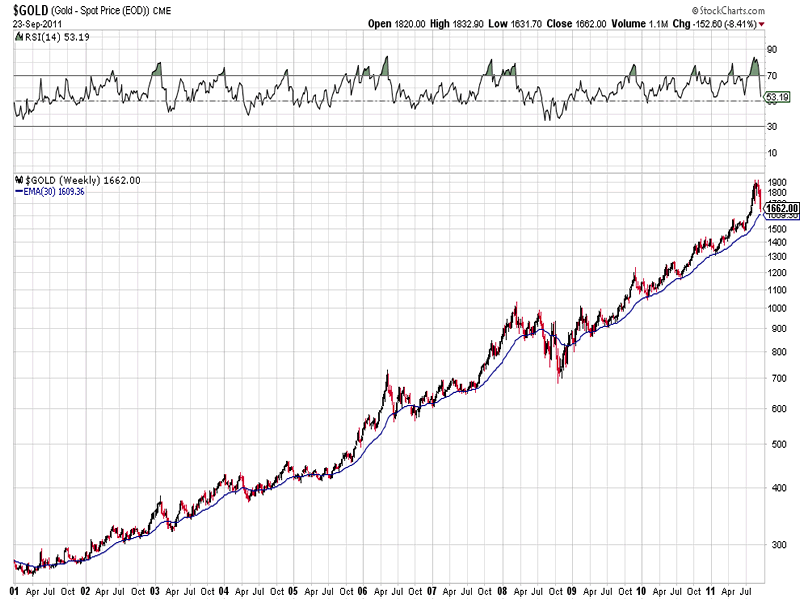
Chart courtesy stockcharts.com
Actually, the 150 Days EMA, which is a proxy for the 30 Weeks EMA, also provided support during the 1980 price explosion:
When we look at the following chart, we can see that the USD broke above the pink resistance line last week. Price is now also above the 200EMA, which acted as support and resistance in the past. This is a Bullish Development, and should be bad for precious metals and Equity Markets.
However, when we look at the gold price (2nd part of the chart), we can see that the 150EMA has not been broken to the downside yet.
For GDX (Market Vectors Gold Miners ETF) the 400EMA seems to be the level of importance. It has been tagged on Friday.
Silver looks much worse than Gold and Gold miners right now. That’s the reason why I haven’t touched silver at all since late April, when I expected Silver to crash. For the first time since 2008, the price has broken decisively below the 150EMA, which seems to be the level of importance (for both Gold and Silver).
Last but not Least, the SP500 also dropped below its 400EMA.
So unless we are about to see 2008 all over again, I think Gold and GDX are in the best position.
Silver is a broken parabola, and it takes time, a lot of time to reach new highs (if ever), as I have written several times.
The stock markets need to recover their 400EMA before they are in a favorable position.
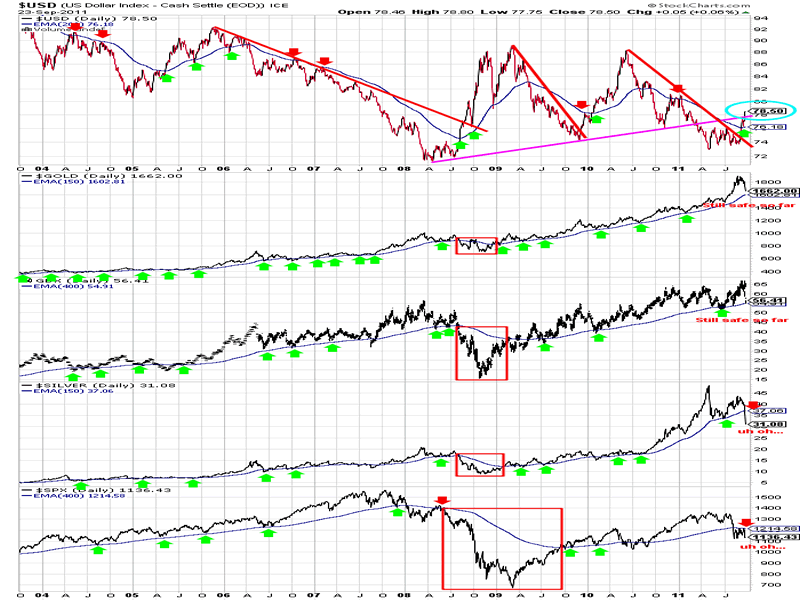
Chart courtesy stockcharts.com
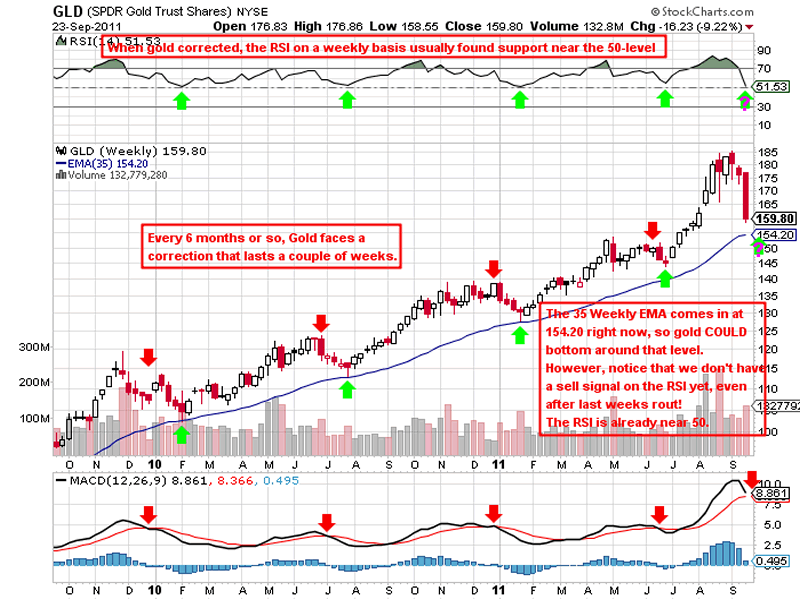
Chart courtesy stockcharts.com
I do have something positive to say about silver: Price is now 21.41% below its 50EMA. Whenever price fell more than 10% below its 50EMA during this bull market, silver was always at or near a bottom, EXCEPT for 2008. If we are about to see 2008 all over again, or if the commodity bubble burst last week, silver could drop another 50% from current levels, if not more…
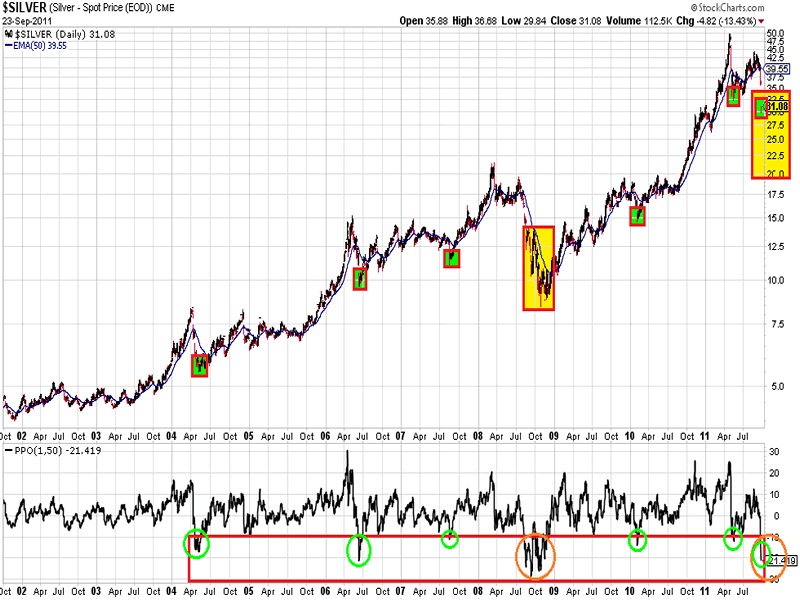
Chart courtesy stockcharts.com
Here’s what could happen if we are about to see 2008 all over again (this is an updated version of a chart I published on July 20th)
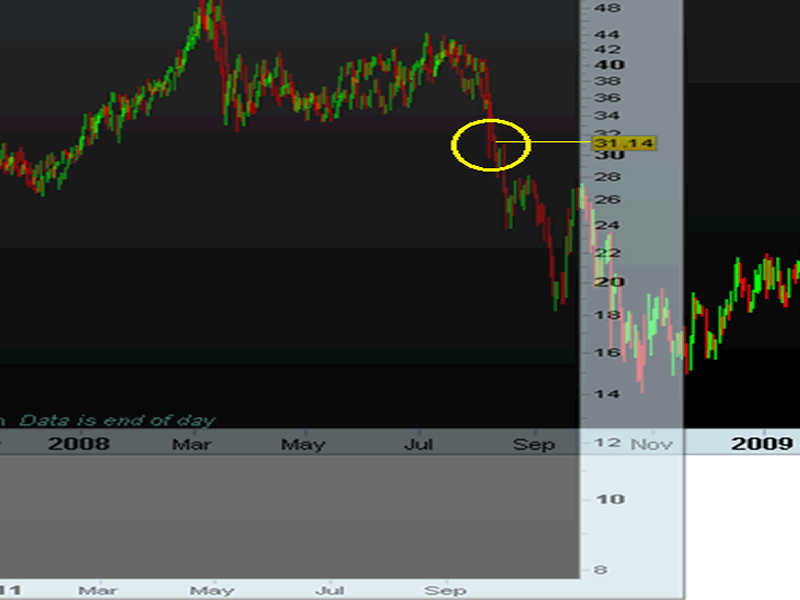
Chart courtesy Prorealtime.com
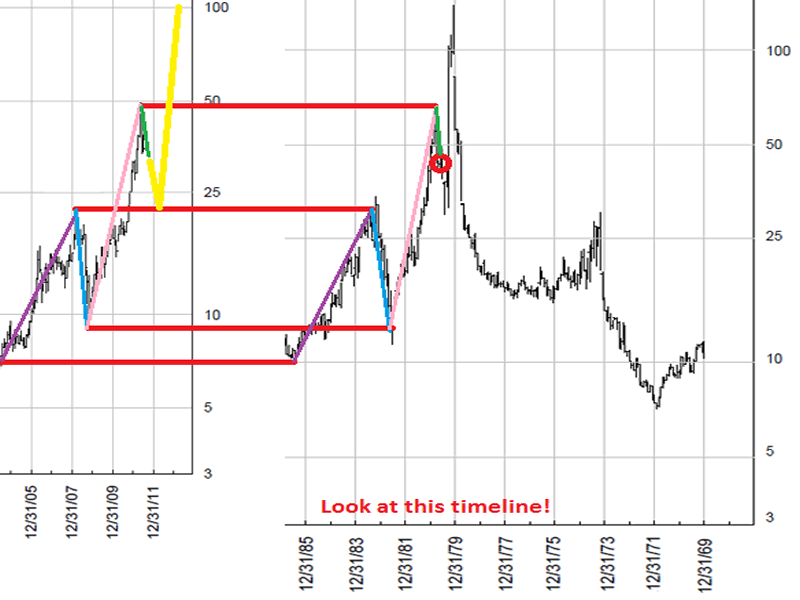
Here’s another positive picture for silver, which I posted a while ago:
Silver Wheaton looks very bad at this point, as it is forming a Head & Shoulders Pattern:
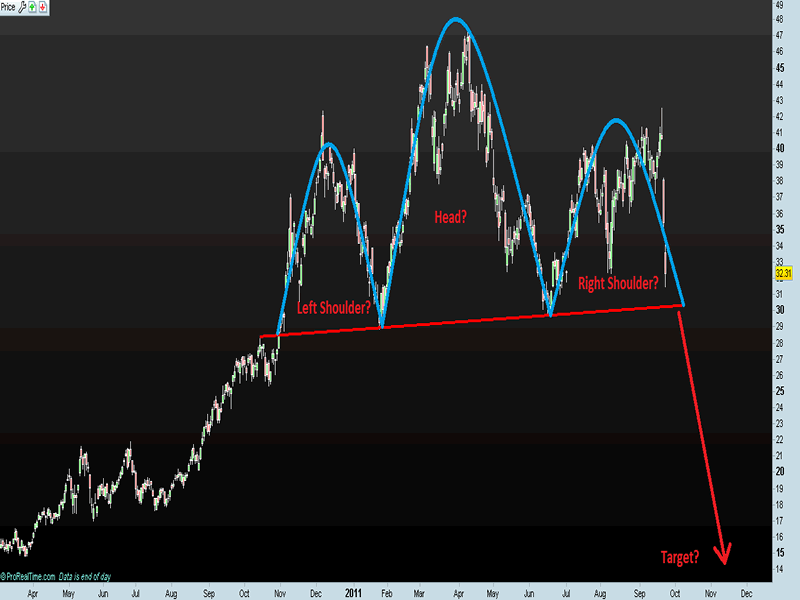
Chart courtesy Prorealtime.com
As you probably know by now, I am fascinated by historical comparisons. Here’s my latest one: The gold price compared to the Shanghai Bubble:
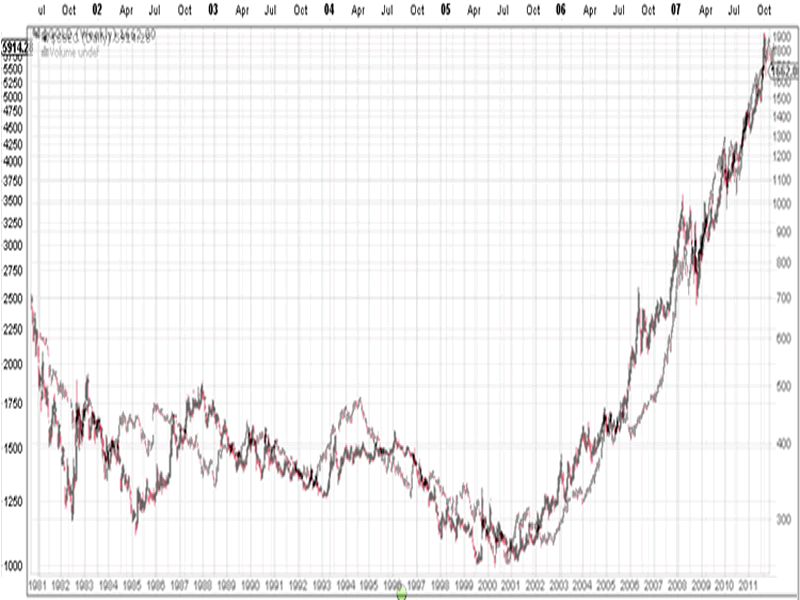
Chart courtesy stockcharts.com
I calculated the Gold-to-10Year Yields, which got me the following chart:
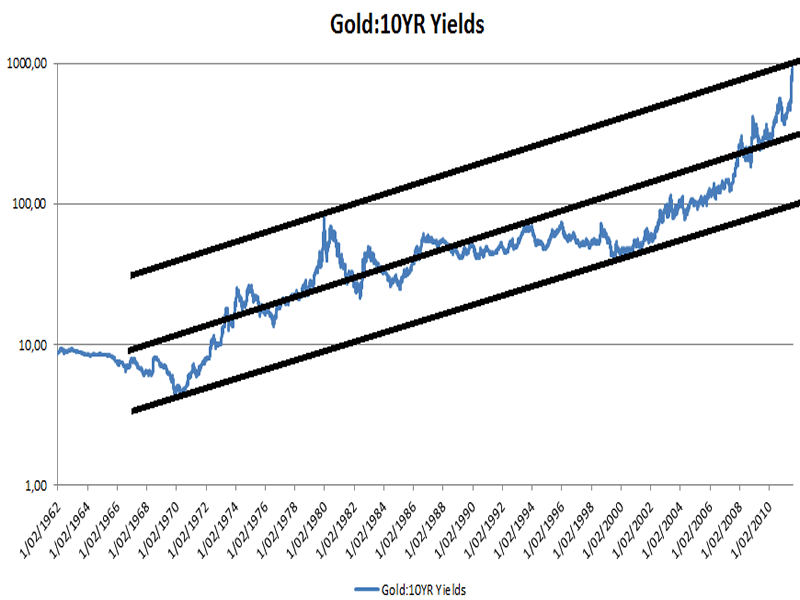
The ratio hit a long term resistance line a couple of days ago, just like it was in the early 80′s.
It shows that gold has never been more expensive relative to bond yields.
On the other hand, low yields mean expensive bonds.
In my opinion, it shows that both gold and bonds have never been more expensive TOGETHER ever before.
I then decided to plot the Gold:10Years ratio together with the SP500:
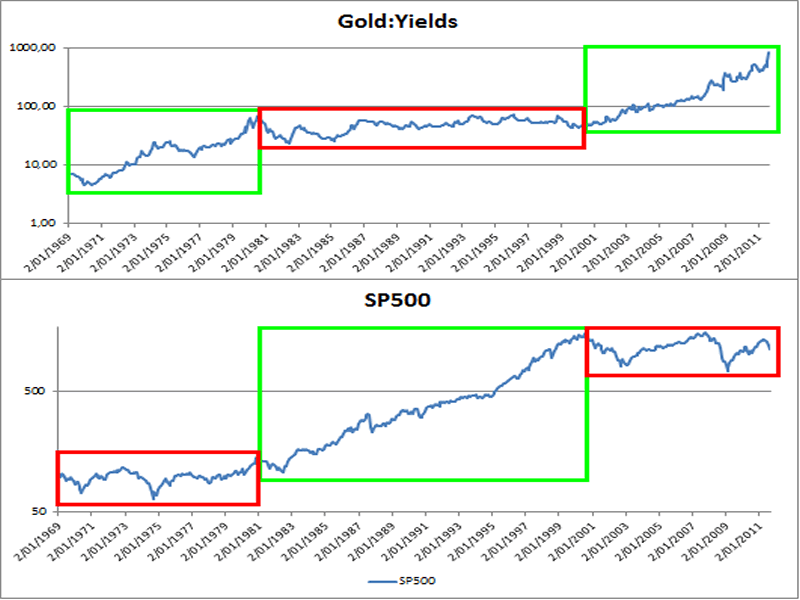
Isn’t it interesting to see that bull markets in the Gold:10YR Yields ratio are in line with Bear markets in the SP500, and that Bear Markets in the Ratio are accompanied by Bull markets in Equity markets?
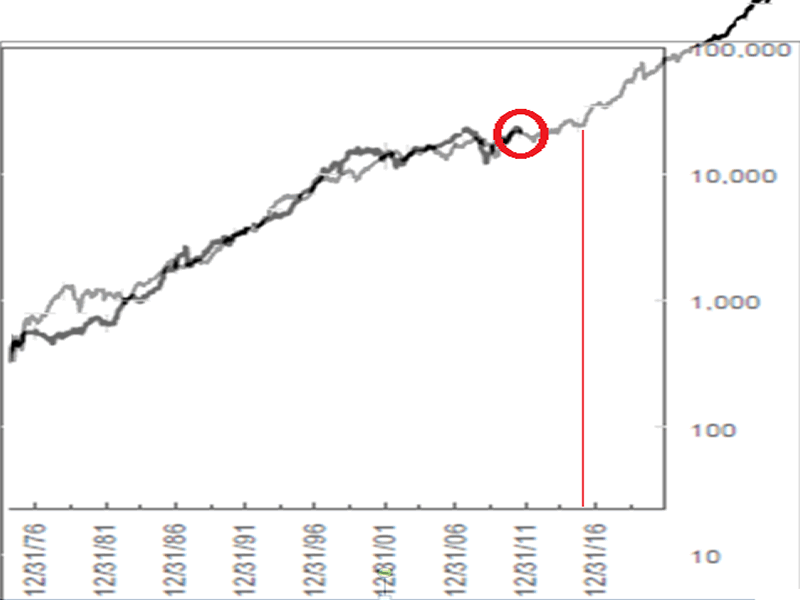
To end this article, I compared the Dow Jones index now with the Dow Jones in the ’70s:
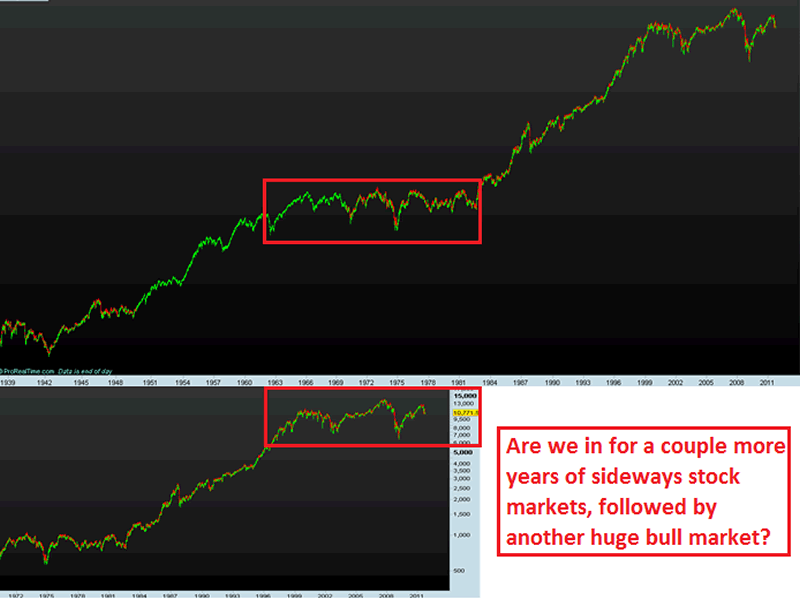
Chart courtesy Prorealtime.com
The Total Return index shows a similar picture:
For more analyses and trading updates, please visit www.profitimes.com
Willem Weytjens
www.profitimes.com
© 2011 Copyright Willem Weytjens - All Rights Reserved
Disclaimer: The above is a matter of opinion provided for general information purposes only and is not intended as investment advice. Information and analysis above are derived from sources and utilising methods believed to be reliable, but we cannot accept responsibility for any losses you may incur as a result of this analysis. Individuals should consult with their personal financial advisors.
© 2005-2022 http://www.MarketOracle.co.uk - The Market Oracle is a FREE Daily Financial Markets Analysis & Forecasting online publication.