


Has the Stock Market Index Been Naughty or Nice?
Stock-Markets / Stock Markets 2011 Nov 13, 2011 - 12:59 AM GMTBy: J_W_Jones

 At the beginning of this week I warned readers that the market was extremely overbought and that a top could be forming. While it is still unclear whether a major top has formed, it is without question that we saw a major correction on Wednesday as yields on Italian debt caused margin requirement adjustments at the London Clearing House.
I generally will not make bold predictions as today’s financial markets are so dynamic that a lot can change in a short period of time. However, Tuesday night I sent out a video to members of my service which I entitled my “European Rant.” My soapbox rant discussed where we were in the market and what my thoughts were regarding the structural issues in Europe.
Watch my European Rant here: European Rant
Little did I know that the very next day Italian 10 year bond yields would surge calling the fiscal stability of the Eurozone back into question. My intent for the video was to give my members a better understanding of what was going on in Europe. As it turned out, the video was spot on in its timing so I could not help but share it with readers.
My current view on the S&P 500 is neutral. I am watching several key price levels on the S&P 500 Index for clarity, but so far Mr. Market has not tipped his hand. I am watching for a breakout over recent highs around the 1,290 area before I consider layering back into long positions. Consequently, I am watching the 1,230 and 1,190 areas as potential short entry points. The daily chart of the S&P 500 Index is shown below:
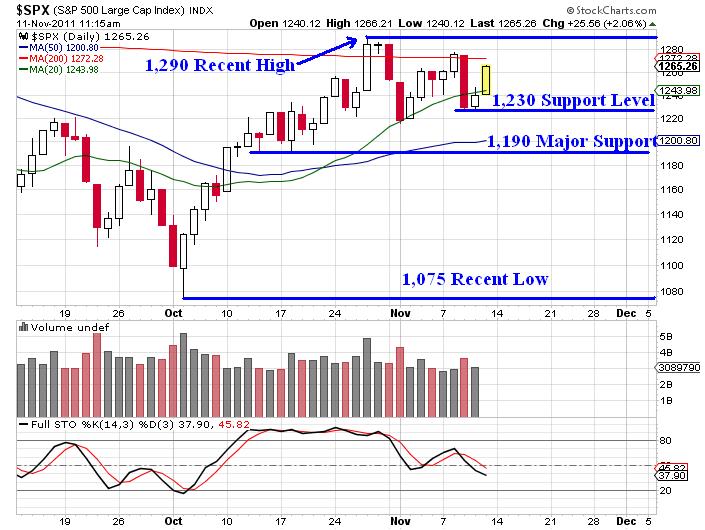
SPX Option Support Levels
Clearly the 1,190 – 1,200 level should offer strong support as the 50 period moving average is resting right at the 1,200 price level currently. If the 1,190 price level breaks down I think we could see a dramatic selloff transpire. On the flip side, if the recent highs around 1,290 are taken out to the upside we could see a rally that takes us back to the 2011 highs around 1,370. Right now I am going to wait patiently and let others do the heavy lifting.
The 1,257 price level on the S&P 500 Index is a major pivot that I am going to be watching closely. If the bulls can push prices above that area for two or more consecutive closes I think the bulls may have the bears on the ropes. As of the writing of this article, the SPX is currently trading around the 1,263 level. If the bulls can hold up prices into the closing bell, we could see an extension higher on Monday. The chart of SPX below illustrates the key 1,257 price level:
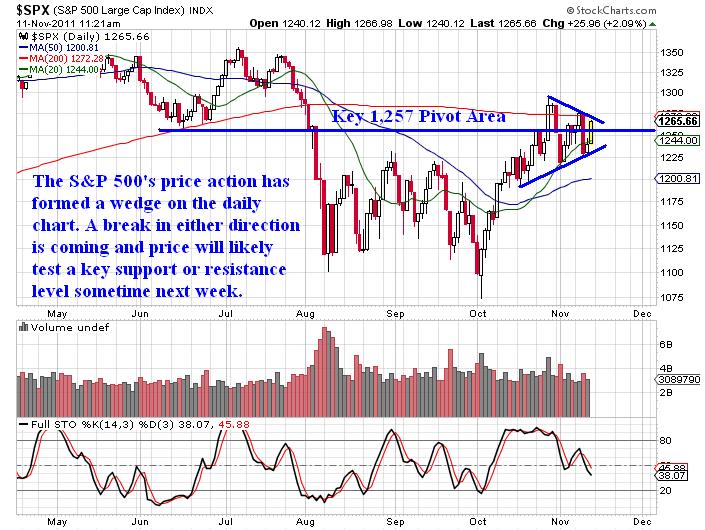
SPY Option Trading Setup
At the close on Tuesday I was involved in a SPY 122 Put Calendar Spread for members which capitalized on time decay (Theta) as well as lower prices in the SPY ETF. Thursday morning I took profits on the position locking in a gain of around 13% on maximum risk. Recently I have had several winning trades for members of my service, but I admittedly have been taking profits aggressively and trading in smaller size due to the wild volatility swings that are commonplace in this market.
Trading is a marathon, not a sprint and my focus is to live to play another day. Since the inception of my service, I am running at about a 70% success rate based on all trades that have been taken. I am not telling you this to boast, I am telling you this to point out that I am wrong 30% of the time. In the trading world the overall numbers look good, but if my position sizing is not appropriate the 30% could potentially blow up my account.
With that in the back of my crowded mind, I try to use smaller position sizes and lock in profits aggressively during times of widespread volatility. I take fewer trades and focus my attention on risk and money management during times of heightened volatility which has been prevalent the past few weeks.
In addition to monitoring my risk profile, I am watching the price action in two underlying assets which I believe will throw off clues about where this market may be headed. The EUR/USD currency pair has been on my screens quite a bit the past few weeks. Most of the time I monitor the U.S. Dollar Index futures as well, but recently my focus has been on the currency pair. The chart below illustrates the correlation between the Euro currency and the S&P 500 since September:
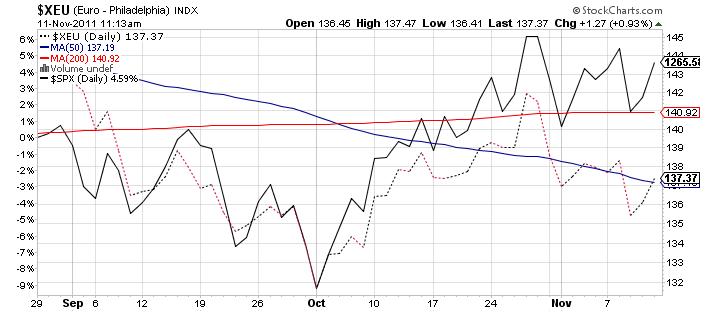
Euro Index Trading
Since the beginning of September, the moves in the S&P 500 have been very similarly correlated to the Euro currency as can be seen above. Additionally the Dow Jones Industrial Average also has very similar congruence in terms of price action when compared to the Euro.
The strength of the Euro has a profound impact on the price action of the U.S. Dollar Index. The U.S. Dollar Index soared on Wednesday and took out recent resistance. Since Wednesday, the Dollar has been retracing a large portion of the move higher. The daily chart of the Dollar Index is shown below:
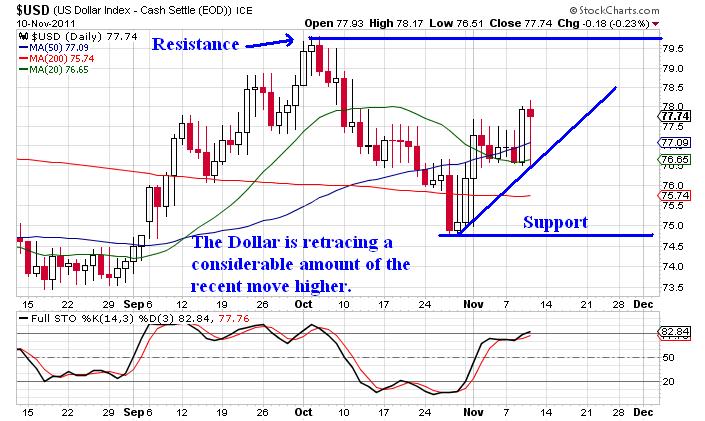
USD Dollar Index Trading
It is a bit too early to tell for sure, but the Dollar could be rolling over based on austerity plans coming out of Italy and the expectation that the Eurozone is going to try to get ahead of the crisis unfolding based on the yields of Italian government debt instruments.
Last and certainly not least is the banking sector of the economy. The KBW Banking Index (BKX) is a proxy for financial institutions domestically. The KBW Banking Index is a great indicator for the future price action in the S&P 500. Stocks cannot rally if the banks do not participate with higher prices.
If stocks are selling off and the financials are holding up well many times equity indices will reverse higher. The key price level that a lot of traders are monitoring currently is the 40 area. The daily chart of the KBW Banking Index is shown below:
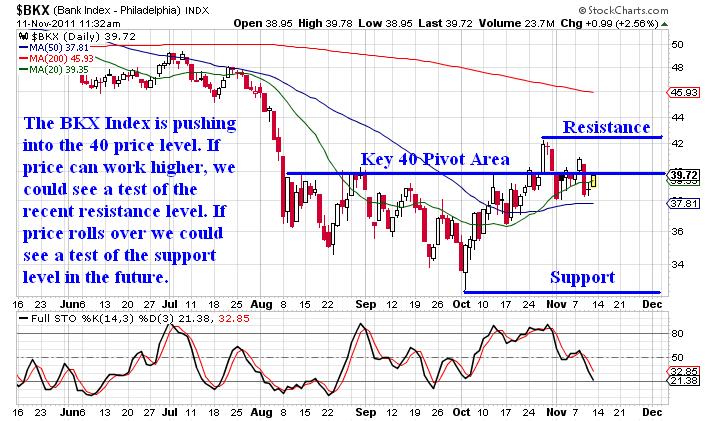
Banking Index XLF, FAS Trading
Similar to the key 1,257 pivot level on the S&P 500 Index, the key 40 price level on the KBW Banking Index has a similar impact on the underlying price action. If the bulls can push the BKX above the 40 price level and hold it up then a rally in stocks becomes more likely. As I write this, the BKX is trading at $39.78 / share so we are getting close to crunch time. The S&P 500 has broken above its pivot during intraday trade and now a lot of eyes are watching to see if the banks can follow through.
Ultimately investors could be looking at a Santa Claus rally or an absolutely ugly selloff in the near future. I will be monitoring the key price levels mentioned above on the S&P 500 and will wait patiently for Mr. Market to tip his hand. This is a tough market to trade and volatility is running relatively high. Headline risk coming out of Europe is seemingly constant. I would keep position sizes light and monitor risk aggressively. This is not the time to be a hero!
Subscribers of OTS have pocketed more than 150% return in the past two months. If you’d like to stay ahead of the market using My Low Risk Option Strategies and Trades check out OTS at http://www.optionstradingsignals.com/specials/index.php and take advantage of our free occasional trade ideas or a 66% coupon to sign up for daily market analysis, videos and Option Trades each week.
J.W. Jones is an independent options trader using multiple forms of analysis to guide his option trading strategies. Jones has an extensive background in portfolio analysis and analytics as well as risk analysis. J.W. strives to reach traders that are missing opportunities trading options and commits to writing content which is not only educational, but entertaining as well. Regular readers will develop the knowledge and skills to trade options competently over time. Jones focuses on writing spreads in situations where risk is clearly defined and high potential returns can be realized.
This article is intended solely for information purposes. The opinions are those of the author only. Please conduct further research and consult your financial advisor before making any investment/trading decision. No responsibility can be accepted for losses that may result as a consequence of trading on the basis of this analysis.
© 2005-2022 http://www.MarketOracle.co.uk - The Market Oracle is a FREE Daily Financial Markets Analysis & Forecasting online publication.