


Stock Market Top Are We There Yet?
Stock-Markets / Stock Markets 2012 Feb 13, 2012 - 02:03 AM GMTBy: Andre_Gratian

 Current Position of the Market
SPX: Very Long-term trend - The very-long-term cycles are down and, if they make their lows when expected, there will be another steep and prolonged decline into 2014.
SPX: Intermediate trend - Intermediate uptrend still intact, but short-term top imminent.
Analysis of the short-term trend is done on a daily basis with the help of hourly charts. It is an important adjunct to the analysis of daily and weekly charts which discusses the course of longer market trends.
Market Overview
Last week's heading was "NEXT SHORT-TERM TOP IN SIGHT". By the end of the week, indices did appear to have run into some resistance. The SPX, which had a high of 1354, pulled-back to an intra-day low of 1337, and closed at 1342 - not exactly a significant reversal, just yet. The market will have a chance to expand on that next week, but it will have to show much more weakness before it can gain short-term top status.
Two cycles are at play which will decide the near-term fate of the market. A minor one has already put the brakes on upward creeping prices. It may have bottomed on Friday, or has another day or two to go. However, the short-term trend of the market is more likely to be decided by the cycles nesting in the first week in March which could turn out to be either a market high or a market low. The next week will tell us what to expect, but we need to keep in mind that there is an unfilled projection to 1364.
Whether the high point of the rally comes a week or two weeks from now, there is no question that a short-term top is forming. For the first time since the current rally started in late November, the daily chart indicators are showing real weakness, and the contrary indicators are on the verge of turning up.
The VIX broke out of an intermediate trend line and closed at a two-week high, which was sufficient to start the weekly MSO in a new uptrend after six months of consolidation.
The charts will do a better job of showing the shift that is taking place, so let's start by looking at the SPX Weekly Chart.
Chart analysis
It has been a while since we've analyzed this chart and, during this time, the lower indicator (MSO) has reached its upper limit and has begun to move sideways. This is a warning that the intermediate trend is overbought and that we should be on the lookout for a market top.
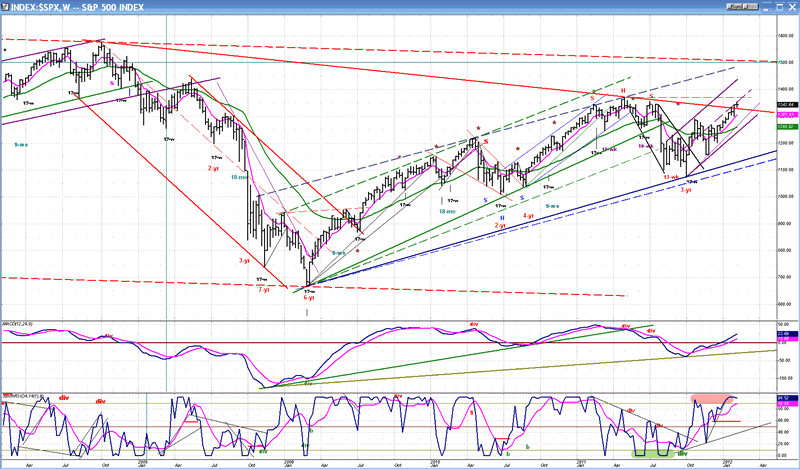
The long-term trend which started in March 2009 temporarily came to an end in early May of last year. The subsequent decline from that level caused a readjustment in the trend. Because we are getting closer and closer to the 2014 very long-term cycle lows, when prices come outside of the blue channel, it will most likely signal that the bull market from 2009 is over and that we have started another bear market.
This is not imminent. The Russell 2000 made a new recovery high in May 2011 and was joined in those higher grounds by the QQQ in July. In the past few weeks the latter has really taken off reaching an 11-year high; and last week the Dow Jones industrial made it a trio by trading at its highest point since 2007. Others may join them in the months ahead, but what this really means is that the bull market top is probably not right around the corner.
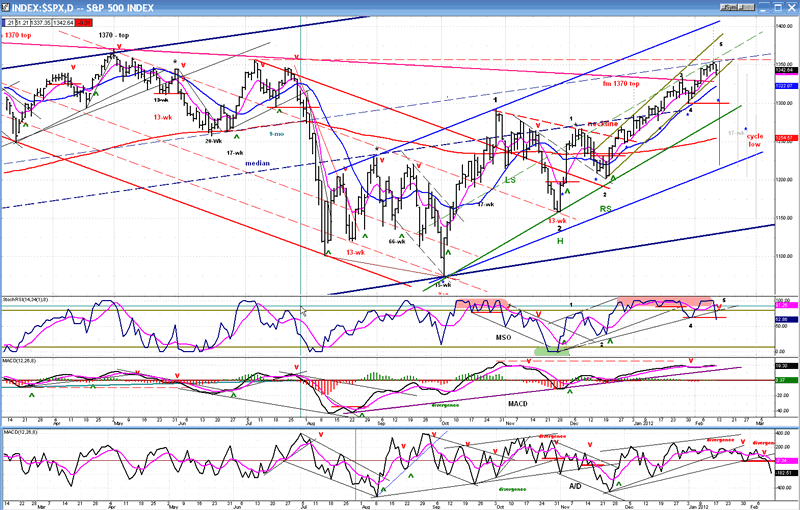
With an overbought weekly MSO, our attention should now shift to the Daily Chart for a closer look at the state of the uptrend.
Let's start by pointing out the most significant change that occurred last week: a sell signal was generated by two of the three indicators. It's so obvious that it does not even have to be debated. The A/D oscillator is always the early bird. This is the first time that it has gone negative in eight weeks. The MSO followed with its lowest close in the same time period. The MACD should not be far behind.
Note, however, that it is only a strong warning signal which has not yet been confirmed by a trend line break. There are other reasons why the confirmation could be delayed by a few days: the minor cycle which pulled the index down on Friday may have already bottomed, and there is also an unfilled projection to 1364 which could push prices to that level before we roll over. When we do get a bona fide sell signal, it is likely to start only a short-term correction of about three weeks, which would make sense structurally if the labeling has been correct thus far.
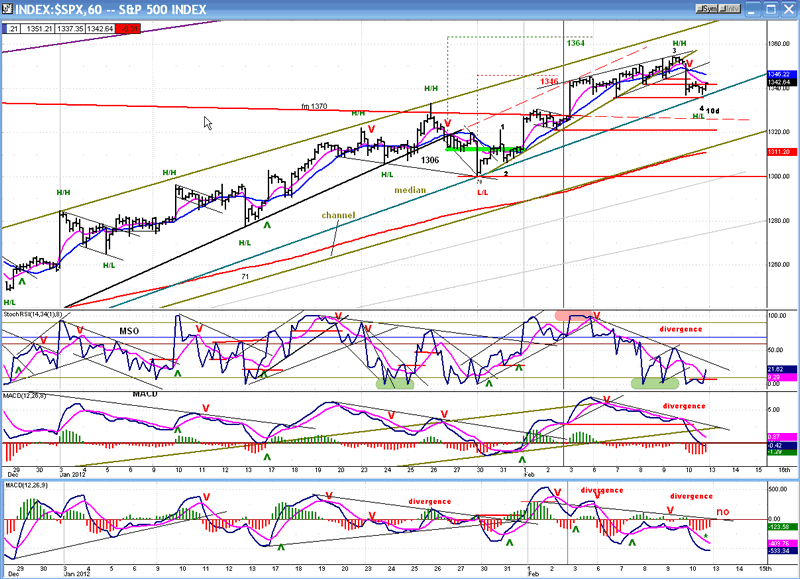
The Hourly chart indicators started to give us warning at the beginning of last week that a near-term top was imminent, but the index continued to edge up until the 10-td cycle was finally able to pull it down on Friday.
There are indications that the cycle may have already bottomed. The index found support on a good trend line as well as at the level of a former near-term low but, with no buy signal given, it could still be in a declining stage and bottom either Monday or Tuesday.
If there should be more weakness early next week, it could indicate that 1354 was the final short-term high and that the correction has already started, especially if the trend line has been broken. In that case, instead of bringing about a new high, the bottoming cycle would simply give us a two or three day rally which would be followed by a resumption of the decline. From a structural point of view, this is not the preferred view, but it should be kept in mind nevertheless.
Cycles
The 10-td cycle did bring weakness right on schedule Friday, but we won't know until Monday if it has already hit bottom or will affect prices adversely for another day or two.
More importantly, there are cycles clustering around the first week in March which will decide the short-term fate of the market. Will it keep going up until then, or will it be pulled down into that time frame after meeting its 1364 projection?
Breadth
The performance of the NYSE Summation Index (courtesy of StockCharts.com) (displayed here for the past three years) has risen spectacularly since the 3-yr cycle low of early October and is an indication of inner market strength. It is also a sign that the market is overbought and may have reached its price limit over the near-term.
The RSI is giving the same signal. It is overbought and just beginning to roll over.

Sentiment
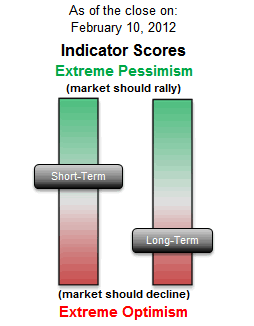
The SentimenTrader (courtesy of same) long-term indicator continues to warn of a potential top in the market, but the short-term has relented after Friday's decline, and now allows for a possible near-term bounce.
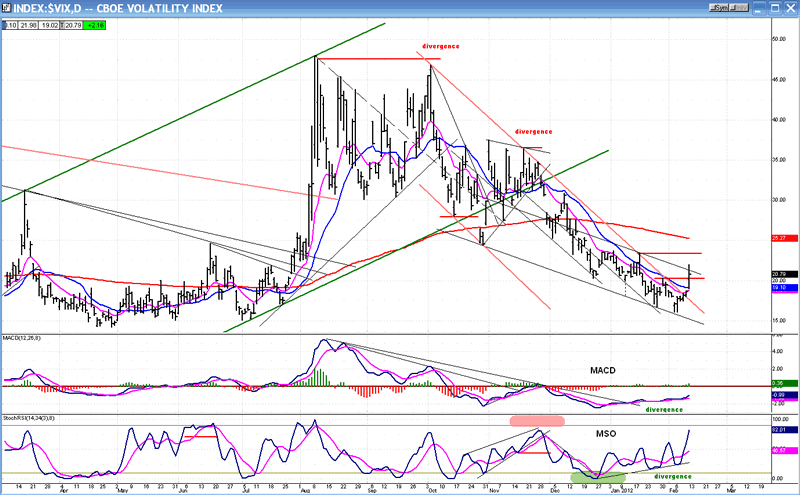
VIX:
The VIX has done what it does at market tops: it broke out of an intermediate downtrend line and is about to start an uptrend. Because there has not been enough time for a base of consequence to be built, one should only expect a minor move at this time. If the SPX has a little more of an uptrend left in store before it reaches a short-term top, the base of the VIX could be expanded.
The indicators have been signaling for some time that a bottom was near. The MACD and MSO have been showing positive divergence for about a month while the VIX continued to decline and make new lows. That process now appears to have been stopped, and the low of 16.10, which was made on 2/03, is likely to hold for quite a while, although it will probably be tested over then few days.
BONDS
This is a close up of TLT, another contrary indicator. The chart only shows the consolidation pattern which the index has been making ever since it has been correcting from its intermediate term high of 125.03 on 10/4/11, the same date on which the SPX made its intermediate low.
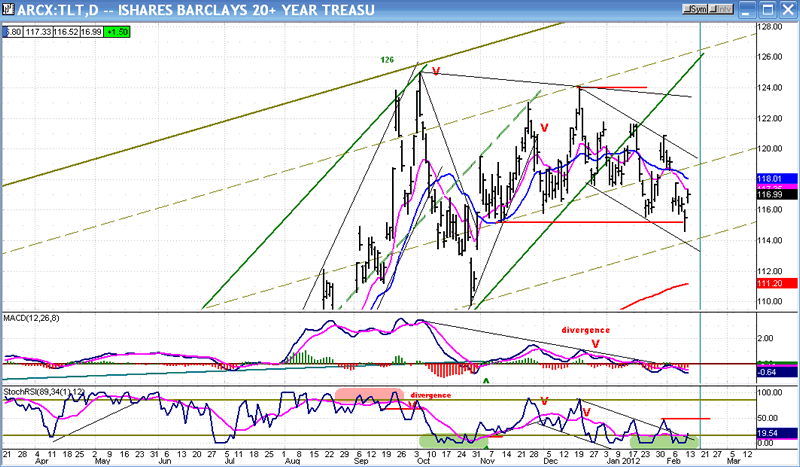
On Thursday, TLT filled its near-term projection of 115, which is likely to become the low of the consolidation. The budding reversal is best observed in the MSO, but we can expect more backing and filling before the index is ready to challenge its downtrend line
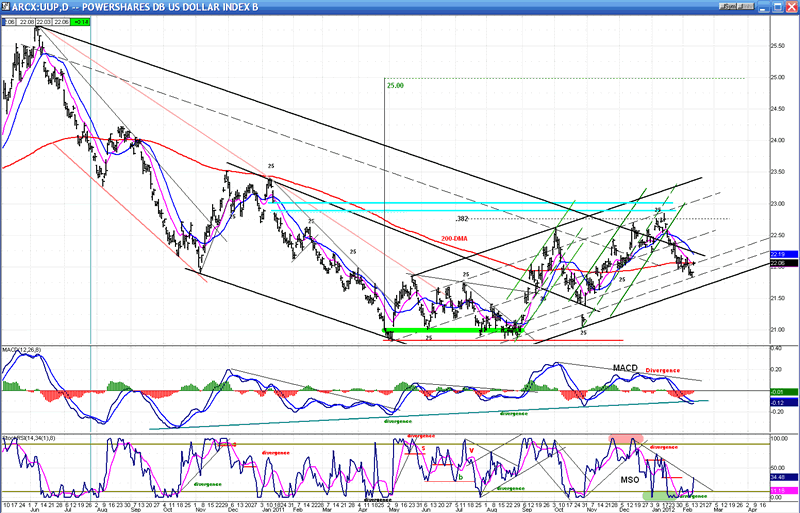
UUP (Dollar ETF)
Since breaking out of a four-month base, UUP has been in a tentative uptrend -- but an uptrend nevertheless -- consisting of higher highs and higher lows within a well-defined up-channel. It has also moved in a very consistent 25-td pattern which sometimes marked a high and sometimes a low. The last 25-day cycle brought about a high 24 days ago and, true to form, the index is now showing signs of reversing. This is most noticeable in the MSO which has turned up, similarly to TLT.
We don't know how far UUP will go on this next 25-day leg, but we do know that its base has given a projection to 25.00 (which corresponds to 90 on the US dollar). How and when it will reach that target is not foreseeable at this time, but it does suggest that, if realized, this could be a potential opposing force to equity markets and gold over the next few weeks.
Over the near-term, UUP joins VIX and TLT in signaling that a short-term reversal is imminent in SPX.
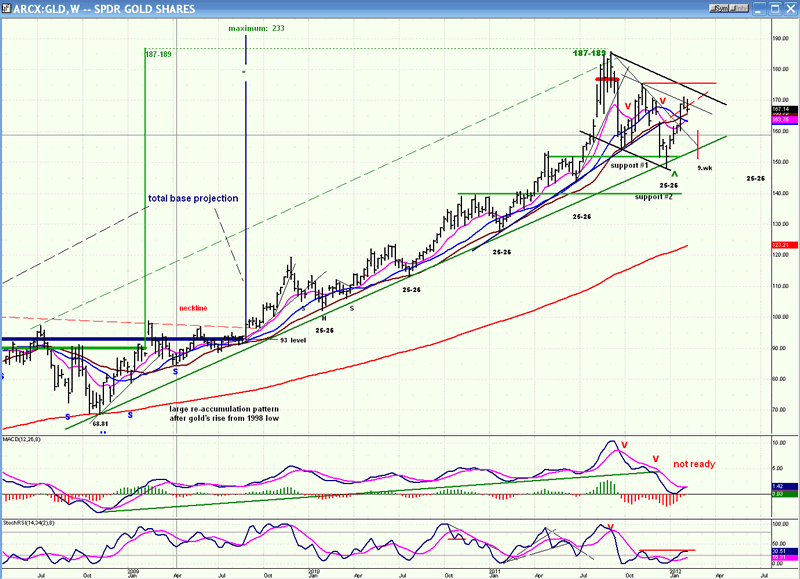
GLD (ETF for gold)
GLD started a correction after it almost reached its intermediate target of 187. After a decline of 38 points, it found support on its long-term trend line in a time frame which coincided with a 25-26 week cycle low. This provident combination fostered a trampoline bounce which retraced .618 of the entire correction, but failed to take it outside of its correction channel.
Over the long term, 148 may turn out to be the low of GLD's intermediate correction, but near-term, it appears that it has reached the end of its bounce and needs to retrace to at least 161. A 9-wk cycle low which is due in about 3 weeks may provide the excuse.
After the next pull-back, GLD may be ready to start moving toward its long-term target of 233, or it may require more intermediate consolidation, including a move out of its long-term trend line. We'll review its action and prospects in another few weeks.
Summary
Signs that SPX is approaching a short-term top are rapidly accumulating and one should be ready for the index to complete a final move to its 1364 projection over the next few days. There is an off-chance that 1354 will not be surpassed, but this is for the market to decide.
After a reversal has taken place, we should probably expect a move back down to about 1300 or lower over the next three weeks, but this is only a guestimate. The extent of the decline will be determined more precisely after the top has been made.
FREE TRIAL SUBSCRIPTON
If precision in market timing for all time frames is something which is important to you, you should consider a trial subscription to my service. It is free, and you will have four weeks to evaluate its worth.
For a FREE 4-week trial. Send an email to: ajg@cybertrails.com
For further subscription options, payment plans, and for important general information, I encourage you to visit my website at www.marketurningpoints.com. It contains summaries of my background, my investment and trading strategies and my unique method of intra-day communication with Market Turning Points subscribers.
By Andre Gratian
MarketTurningPoints.com
A market advisory service should be evaluated on the basis of its forecasting accuracy and cost. At $25.00 per month, this service is probably the best all-around value. Two areas of analysis that are unmatched anywhere else -- cycles (from 2.5-wk to 18-years and longer) and accurate, coordinated Point & Figure and Fibonacci projections -- are combined with other methodologies to bring you weekly reports and frequent daily updates.
“By the Law of Periodical Repetition, everything which has happened once must happen again, and again, and again -- and not capriciously, but at regular periods, and each thing in its own period, not another’s, and each obeying its own law … The same Nature which delights in periodical repetition in the sky is the Nature which orders the affairs of the earth. Let us not underrate the value of that hint.” -- Mark Twain
You may also want to visit the Market Turning Points website to familiarize yourself with my philosophy and strategy.www.marketurningpoints.com
Disclaimer - The above comments about the financial markets are based purely on what I consider to be sound technical analysis principles uncompromised by fundamental considerations. They represent my own opinion and are not meant to be construed as trading or investment advice, but are offered as an analytical point of view which might be of interest to those who follow stock market cycles and technical analysis.
Andre Gratian Archive |
© 2005-2022 http://www.MarketOracle.co.uk - The Market Oracle is a FREE Daily Financial Markets Analysis & Forecasting online publication.