


U.S. Payroll's Disaster Made Worse by Grossly Distorted Unemployment Statistics
Economics / Unemployment Jun 01, 2012 - 04:27 PM GMTBy: Mike_Shedlock

 Jobs +69,000, Employment Rate +.1 to 8.2%, April Jobs Revised Lower to +77,000; Long-term Unemployment +310,000
Quick Notes About the Unemployment Rate
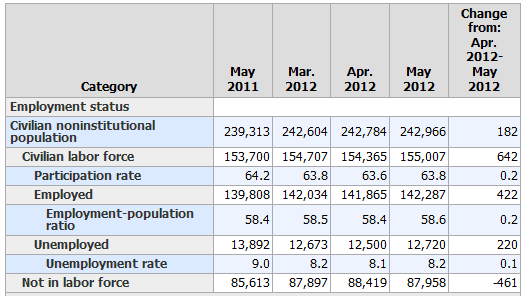
- US Unemployment Rate rose .01 to 8.2%
- In the last year, the civilian population rose by 3,653,000. Yet the labor force only rose by 1,307,000. Those not in the labor force rose by 2,345,000.
- This month the Civilian Labor Force rose by 642,000.
- Those "Not in Labor Force" decreased by 461,000. If you are not in the labor force, you are not counted as unemployed.
- Those "Not in Labor Force" fell to 87,958,000 from last month's record high of 88,419,000.
- By the Household Survey, the number of people employed rose by 422,000.
- By the Household Survey, over the course of the last year, the number of people employed rose by 2,479,000.
- Participation Rate rose .2 to 63.8%
- There are 8,098,000 workers who are working part-time but want full-time work, an increase of 245,000
- Thus of the the net of 422,000 people presumably hired by the household survey, 245,000 were for part-time jobs.
- Long-Term unemployment (27 weeks and over) rose by 310,000.
- Were it not for people dropping out of the labor force, the unemployment rate would be well over 11%.
This month was another disaster. Actual employment fell by 169,000 and the only reason the unemployment rate dropped is the civilian labor force fell by 342,000. These numbers are well past the point of believability and will be revised at some point in my opinion.
Over the past several years people have dropped out of the labor force at an astounding, almost unbelievable rate, holding the unemployment rate artificially low. Some of this was due to major revisions last month on account of the 2010 census finally factored in. However, most of it is simply economic weakness.
Jobs Report at a Glance
Here is an overview of today's release.
- US Payrolls +69,000 - Establishment Survey
- US Unemployment Rate rose .01 to 8.2% - Household Survey
- Average workweek for all employees on private nonfarm payrolls fell .3 hours to 34.4 hours
- The average workweek for production and nonsupervisory employees on private nonfarm payrolls was unchanged at 33.7 hours.
- Average hourly earnings for all employees in the private sector rose by 2 cents.
Recall that the unemployment rate varies in accordance with the Household Survey not the reported headline jobs number, and not in accordance with the weekly claims data.
May 2012 Jobs Report
Please consider the Bureau of Labor Statistics (BLS) May 2012 Employment Report.
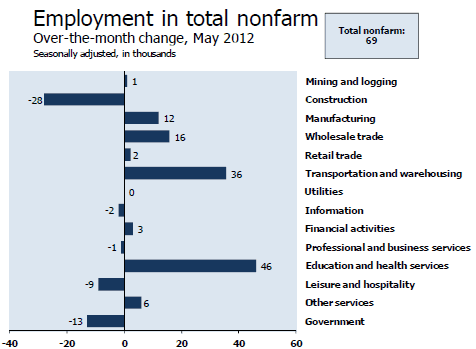
Nonfarm payroll employment changed little in May (+69,000), and the unemployment rate was essentially unchanged at 8.2 percent, the U.S. Bureau of Labor Statistics reported today. Employment increased in health care, transportation and warehousing, and wholesale trade but declined in construction. Employment was little changed in most other major industries.
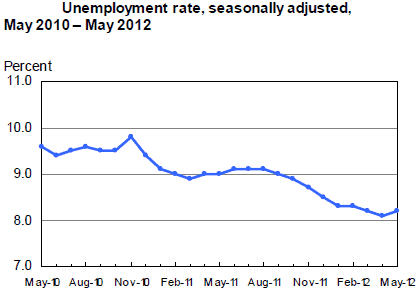
Unemployment Rate - Seasonally Adjusted
Nonfarm Employment - Payroll Survey - Annual Look - Seasonally Adjusted
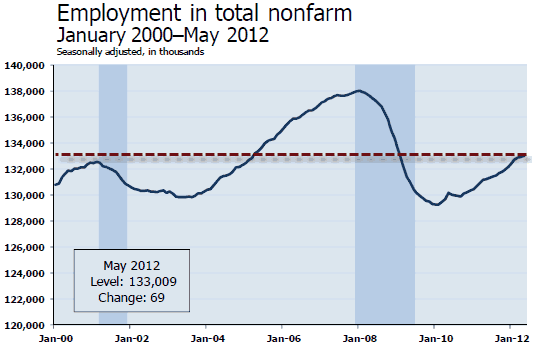
Employment is finally above the total just prior to the 2001 recession.
Nonfarm Employment - Payroll Survey - Monthly Look - Seasonally Adjusted
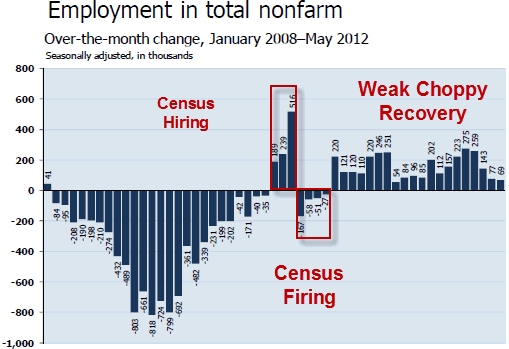
Between January 2008 and February 2010, the U.S. economy lost 8.8 million jobs.
Since a recent employment low in February 2010, nonfarm payrolls have expanded by 4.1 million jobs. Of the 8.8 million jobs lost between January 2008 and February 2010, approximately 46.7% percent have been recovered.
Statistically, 125,000+- jobs a month is enough to keep the unemployment rate flat. For a discussion, please see Question on Jobs: How Many Does It Take to Keep Up With Demographics?
The average employment gain over the last 27 months has been 139,000, barely enough (statistically speaking) to make a dent in the unemployment rate.
Yet, the civilian unemployment rate has fell from 9.8% to 8.2%.
Current Report Jobs
Average Weekly Hours
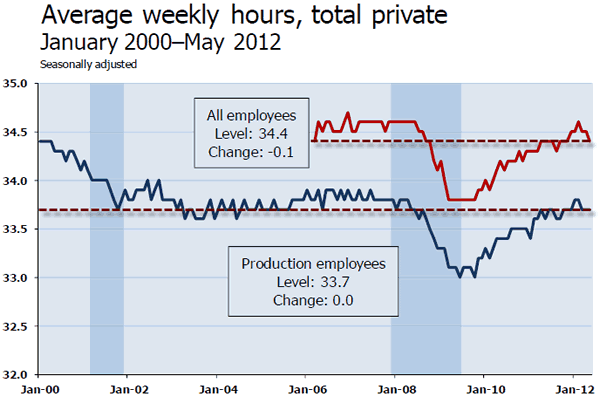
Average weekly hours for all employees on private nonfarm payrolls declined to 34.4 hours in May. Average weekly hours for production and nonsupervisory employees remained unchanged at 33.7 hours.
Average Hourly Earnings vs. CPI
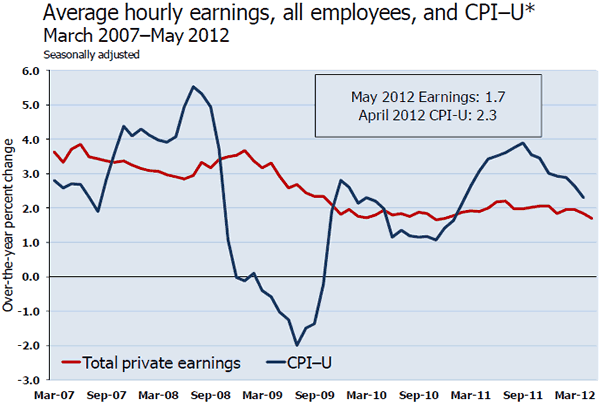
Except in the depths of the recession when the CPI plunged into negative territory, wages have not kept up with the CPI.
"Success" of QE2 and Operation Twist
- Over the past 12 months, average hourly earnings have increased by 1.7 percent. In April, the Consumer Price Index for All Urban Consumers (CPI-U) had an over-the-year increase of 2.3 percent. For about a year beginning in late 2010, price increases outpaced increases in earnings. Since the third quarter of 2011, however, the gap between the two has narrowed.
- Not only are wages rising slower than the CPI, there is also a concern as to how those wage gains are distributed.
BLS Birth-Death Model Black Box
The BLS Birth/Death Model is an estimation by the BLS as to how many jobs the economy created that were not picked up in the payroll survey.
The Birth-Death numbers are not seasonally adjusted while the reported headline number is. In the black box the BLS combines the two coming out with a total.
The Birth Death number influences the overall totals, but the math is not as simple as it appears. Moreover, the effect is nowhere near as big as it might logically appear at first glance.
Do not add or subtract the Birth-Death numbers from the reported headline totals. It does not work that way.
Birth/Death assumptions are supposedly made according to estimates of where the BLS thinks we are in the economic cycle. Theory is one thing. Practice is clearly another as noted by numerous recent revisions.
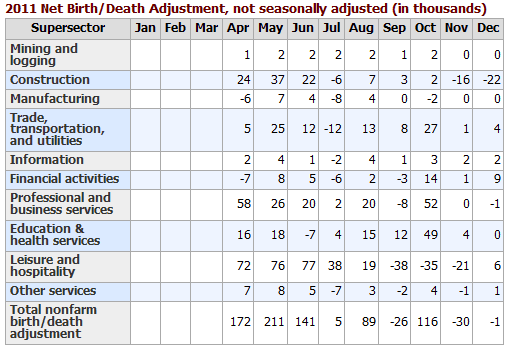
Birth Death Model Adjustments For 2011
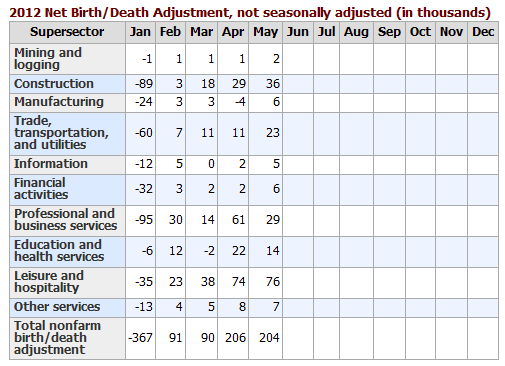
Birth Death Model Adjustments For 2012
Birth-Death Note
Once again: Do NOT subtract the Birth-Death number from the reported headline number. That approach is statistically invalid.
Household Survey Data
In the last year, the civilian population rose by 3,653,000. Yet the labor force only rose by 1,307,000. Those not in the labor force rose by 2,345,000.
That is an amazing "achievement" to say the least, and as noted above most of this is due to economic weakness not census changes.
Decline in Labor Force Factors
- Discouraged workers stop looking for jobs
- People retire because they cannot find jobs
- People go back to school hoping it will improve their chances of getting a job
- People stay in school longer because they cannot find a job
Were it not for people dropping out of the labor force, the unemployment rate would be well over 11%.
Part Time Status
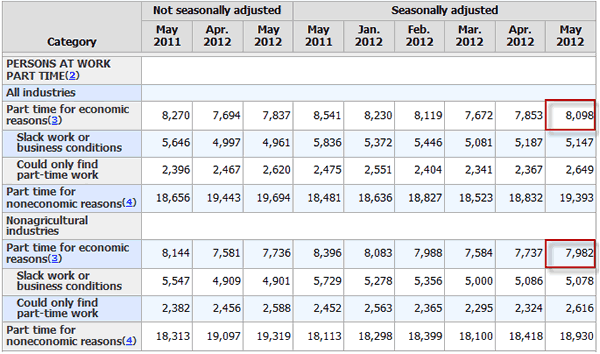
There are 8,098,workers who are working part-time but want full-time work.
BLS Alternate Measures of Unemployment
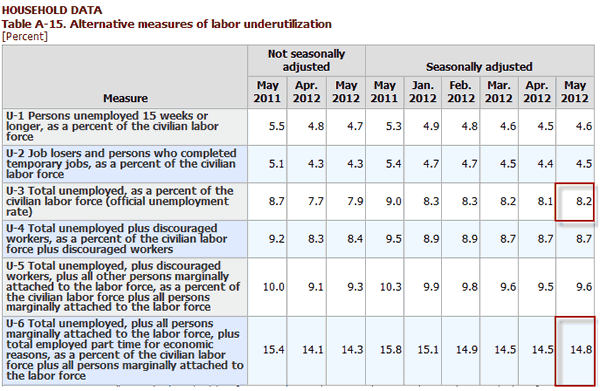
Table A-15 is where one can find a better approximation of what the unemployment rate really is.
Notice I said "better" approximation not to be confused with "good" approximation.
The official unemployment rate is 8.2%. However, if you start counting all the people that want a job but gave up, all the people with part-time jobs that want a full-time job, all the people who dropped off the unemployment rolls because their unemployment benefits ran out, etc., you get a closer picture of what the unemployment rate is. That number is in the last row labeled U-6.
U-6 is much higher at 14.8%. Both numbers would be way higher still, were it not for millions dropping out of the labor force over the past few years.
Duration of Unemployment
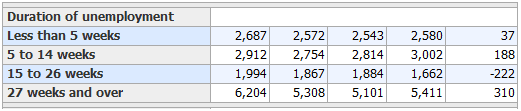
Note the huge drop in duration of unemployment in the 15-26 week category accompanied by an even larger increase in the long-term unemployed category.
Grossly Distorted Statistics
Given the complete distortions of reality with respect to not counting people who allegedly dropped out of the work force, it is easy to misrepresent the headline numbers.
Digging under the surface, the drop in the unemployment rate over the past two years is nothing but a statistical mirage. Things are much worse than the reported numbers indicate.
Last month the seasonally adjusted Civilian Labor Force fell by 342,000. This month it rose by 642,000.This is beyond statistical noise, to the point of pure statistical bullsheet.
By Mike "Mish" Shedlock
http://globaleconomicanalysis.blogspot.com Click Here To Scroll Thru My Recent Post List
Mike Shedlock / Mish is a registered investment advisor representative for SitkaPacific Capital Management . Sitka Pacific is an asset management firm whose goal is strong performance and low volatility, regardless of market direction.
Visit Sitka Pacific's Account Management Page to learn more about wealth management and capital preservation strategies of Sitka Pacific.
I do weekly podcasts every Thursday on HoweStreet and a brief 7 minute segment on Saturday on CKNW AM 980 in Vancouver.
When not writing about stocks or the economy I spends a great deal of time on photography and in the garden. I have over 80 magazine and book cover credits. Some of my Wisconsin and gardening images can be seen at MichaelShedlock.com .
© 2012 Mike Shedlock, All Rights Reserved.
© 2005-2022 http://www.MarketOracle.co.uk - The Market Oracle is a FREE Daily Financial Markets Analysis & Forecasting online publication.