


Is the Stock Market S&P500 Index Closing on on a Top?
Stock-Markets / Stock Markets 2012 Jul 03, 2012 - 09:35 AM GMTBy: Chris_Vermeulen

 Friday’s strong move to the upside caught a lot of traders on the wrong side of the market. Regardless of whether financial pundits refer to it as a short-squeeze or simply panic level buying is largely irrelevant. Time and price are always the final arbiters of financial markets. Price on Friday was clearly telling us that too many market participants were shorting equities and the Euro.
The news coming out of the European Summit is what drove prices higher according to most media outlets. However, few traders have actually taken the time to research the fact that Germany has not technically agreed to the European Stability Mechanism legislation at this point.
The German Constitutional Court has delayed the passage of the ESM legislation on the grounds that this court needs to affirm the agreement is constitutional. Several high profile politicians in Germany have allegedly filed multiple law suits surrounding the new ESM law.
Should the German Constitutional Court determine the ESM legislation is unconstitutional a referendum will go before the German people. The last thing the Eurocratic blue bloods and their banking cartel minions want is regular people actually having a say in the outcome of the Eurozone project.
Ultimately the German people do not appear to be in favor of propping up the rest of Europe in exchange for more empty promises of austerity. Furthermore, the German people recognize that they are taking on a massive risk by loaning money to insolvent banks and other Eurozone sovereigns who have not proven to be prudent with managing their current fiscal conditions.
The decision made by the German high court could have a far-reaching impact on the price action in European financial markets as well as in U.S. domestic financial markets. The outcome of the forthcoming decision will carry far more weight than Friday’s June unemployment report. Already I am reading that should the unemployment number come in significantly weaker than expected Ben Bernanke may work to convert Operation Twist into full blown QE III at the next FOMC Meeting.
The addiction to cheap money by large institutional banks will not end until the Fed is no longer able or willing to continue to print money. Should economic data continue to weaken going into earnings season I am sure the banter regarding QE III will increase at lightning pace and bad news for the economy will be good news for stocks. Poor economic data will increase the likelihood for additional liquidity being provided through a 3rd Quantitative Easing initiative.
Leaving the macroeconomic data aside and focusing on market technicals, we find several unsettling situations in a variety of underlying assets and indicators. The warnings are largely falling on deaf ears as the equity bull parade continues. Before we talk about the S&P 500 Index directly, perhaps we should examine some of the indicators and underlying assets that are sending out bearish smoke signals.
The first chart I would draw your attention to is the McClellan Oscillator which is a widely followed and focuses on market breadth as a possible market indicator for tops and bottoms. Note the key high and low points of the Oscillator and how they correspond with the S&P 500 Index.
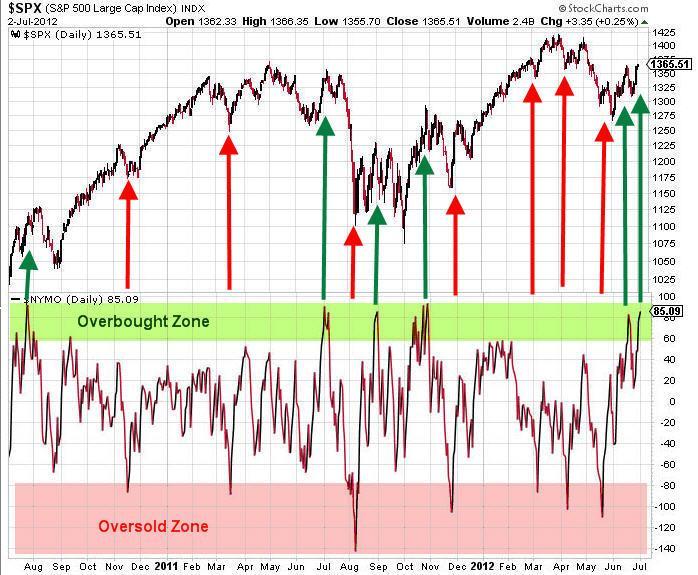
Clearly the McClellan Oscillator is worthy of considering when looking at the S&P 500 Index. As can be seen above, when prices spike into the overbought and oversold zones a major turning point generally is drawing near in the price action. Obviously the current price action in the oscillator is reaching into the extreme overbought zone and looks poised to challenge the highest high over the past 2 years potentially.
In addition to the McClellan Oscillator, another indicator that I look at from time to time also helps to identify key market bottoms. Essentially this indicator measures the NYSE advancing volume versus declining volume. (Note: The opposite ratio will help define key highs) What is important to point out in the chart below is that we did not see major accumulation on Friday compared to data during the past year.
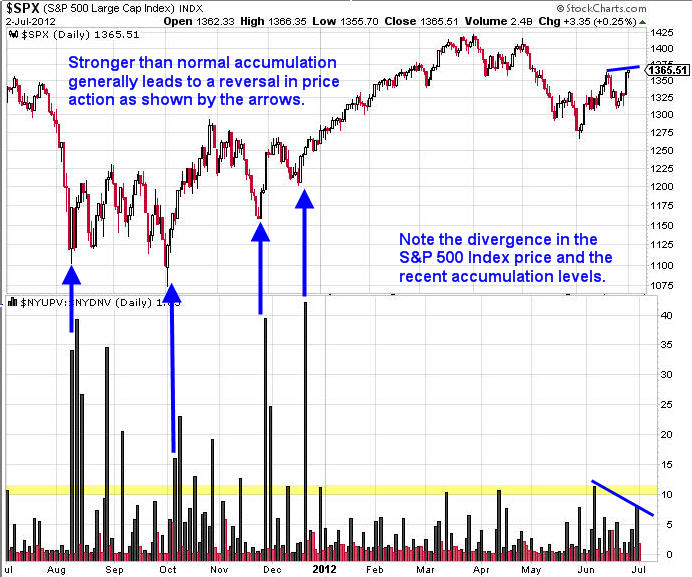
What is absolutely obvious about this chart is the divergence between the price action in the S&P 500 Index and the accumulation readings recently. This divergence could very well mean that a top could form in the not-so-distant future.
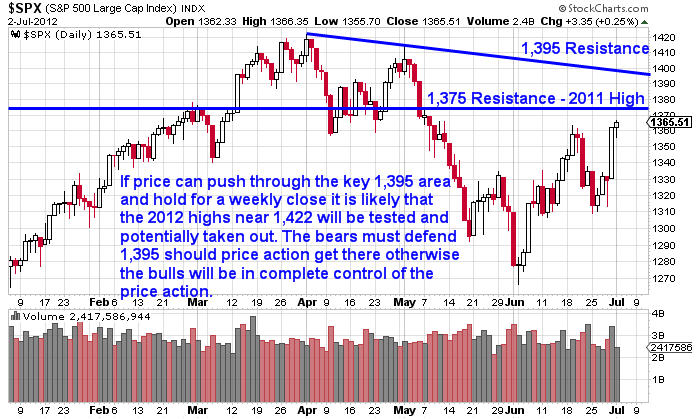
Probability is presently favoring that a top is near for the S&P 500 Index. However, there are two key price levels that I have identified as likely targets for a possible top in the near future. The key resistance levels are 1,375, and 1393 respectively.
If we were to get a weekly close above 1,395 on the S&P 500 Index the bearish expectation will be totally false and a new rally phase will be initiated. The daily chart of the S&P 500 Index shown below illustrates the key price levels that I will be monitoring carefully.
It is likely that we will see prices move slightly higher during the next few trading sessions as I anticipate light volume ahead of the Independence Day holiday. However, the June unemployment report set to be released on Friday could produce some volatility in either direction depending on the outcome of the report.
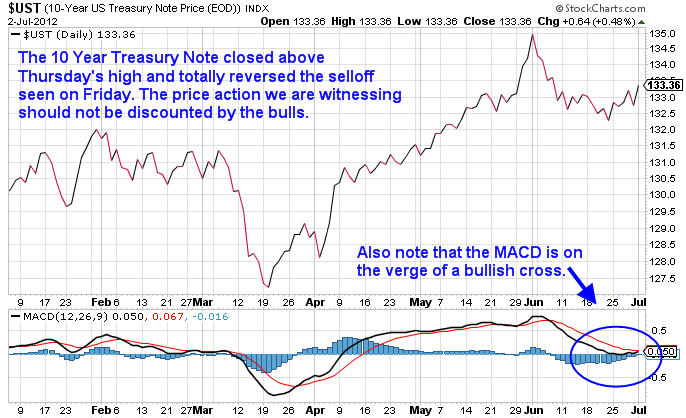
It is without question that we have several warning signs that the S&P 500 Index could be closing in on a top and a potential lower high which is exceedingly bearish. In addition, the strength on Monday in both the 10 & 30 year Treasury bonds should not be ignored.
The Treasury and bond market in general know something that the equity market does not. Treasury bonds in particular completely reversed almost all of the selling pressure they saw during Friday’s rally. The daily chart of the 10 Year Treasury Note is shown below.
In closing, there is a considerable amount of headline risk in Europe and in the Middle East. We have major economic data being released on Friday which could also move financial markets. Right now I am watching the 1,375 and 1,395 price levels on the S&P 500 Index. As long as price is trading below those key price levels, a bearish outcome should not be ruled out completely.
Happy Independence Day & Happy Trading!
Only time will tell and that is why I analyze the market multiple times per week to stay on top of both long term and short term trends. So if you want to keep up with current trends and trades for gold, silver, oil, bonds and the stocks market checkout TGAOG at: http://www.thegoldandoilguy.com/free-preview.php
By Chris Vermeulen
Chris@TheGoldAndOilGuy.com
Please visit my website for more information. http://www.TheGoldAndOilGuy.com
Chris Vermeulen is Founder of the popular trading site TheGoldAndOilGuy.com. There he shares his highly successful, low-risk trading method. For 6 years Chris has been a leader in teaching others to skillfully trade in gold, oil, and silver in both bull and bear markets. Subscribers to his service depend on Chris' uniquely consistent investment opportunities that carry exceptionally low risk and high return.
This article is intended solely for information purposes. The opinions are those of the author only. Please conduct further research and consult your financial advisor before making any investment/trading decision. No responsibility can be accepted for losses that may result as a consequence of trading on the basis of this analysis.
© 2005-2022 http://www.MarketOracle.co.uk - The Market Oracle is a FREE Daily Financial Markets Analysis & Forecasting online publication.