


Stock Market MAP Wave Analysis
Stock-Markets / Stock Markets 2013 Mar 12, 2013 - 01:50 AM GMTBy: Marc_Horn

 In How German DAX on 3 Dec Confirmed a long term bull market MAP Wave Analysis confirmed that we were indeed in a long term bull market and those that registered have had regular updates to help guide you through.
With the Dow and Russell at all time highs, the SPX will challenge its all time highs this week. Failure this week will be confirmed before the end of April. That only leaves the Composite lagging in that field. However the Composite led the way of post 2000 highs after its dramatic correction, leading to the conclusion that 2000 was a yearly peak, but as there is not sufficient data to verify this we will not know for some time to come!
I have migrated much to the new interactive forum on MAP Wave Analysis at www.mapwave.com where the current full analysis can be found including gold and silver as well as the US$, Euro and Yen. The plan is to extend this to cover major global currencies and markets, as well as industrial and agricultural commodities.
Highlights from last weekends update are as follows;
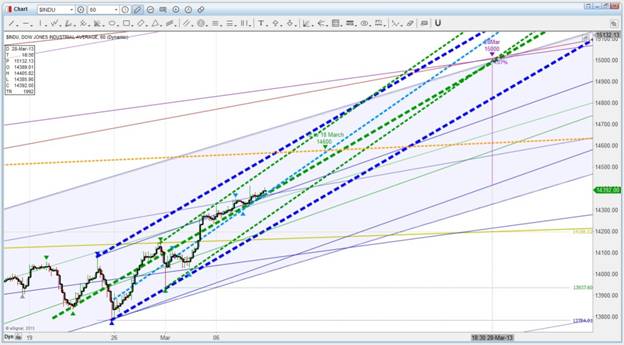
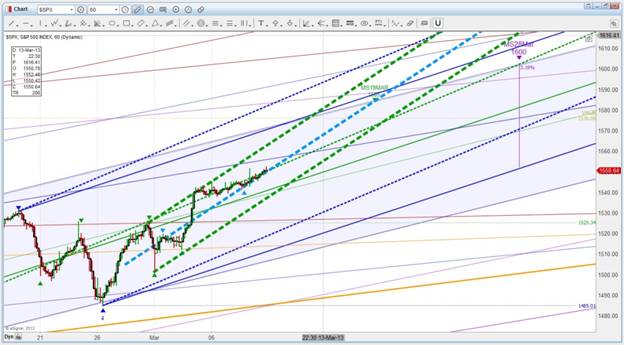
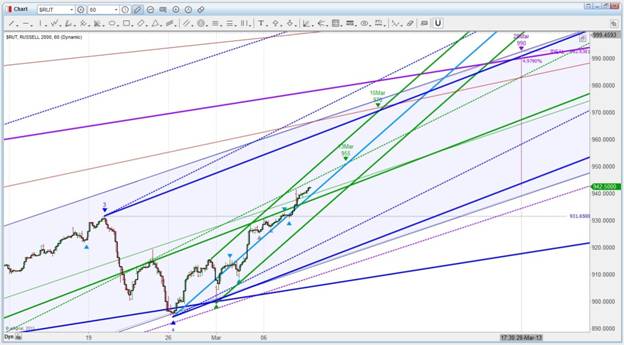
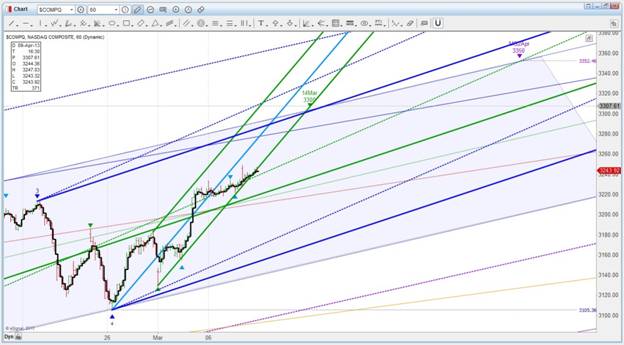
DJIA, SPX, RUT and COMPQ are projecting c3 this week, around the 14th or 5th.
Also shown is the projection on current centi scale wave formation D3 which looks like it will be in by the end of the month!
Dow;
SPX;
Russell;
And Composite;
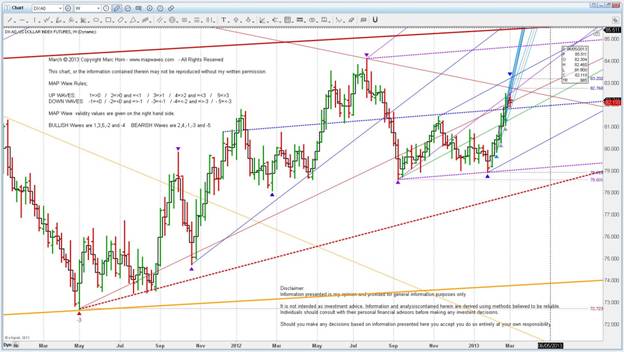
This was not a surprise with the US$ running into resistance as posted on the 5th March (click to read full analysis .
We can see a cluster of resistance that the dollar needs to work through so expect a bit of volatility over the next month or 2. MFD234ML as well as d012ML should offer support.
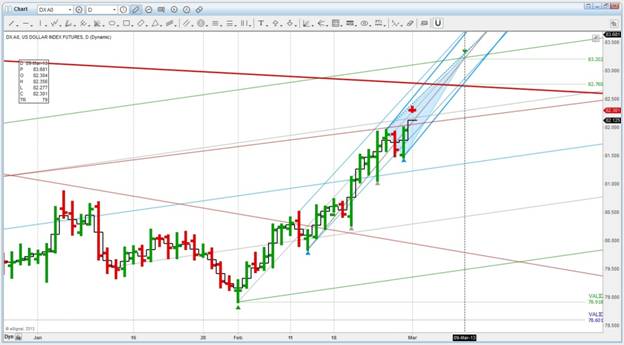
And on the daily tick scale
We have a nice wave pattern so far and it looks like DX US $ putting in c3 top around the 9th March between 82.7 and 83.2. A Better target will become available as the µ waves develop.
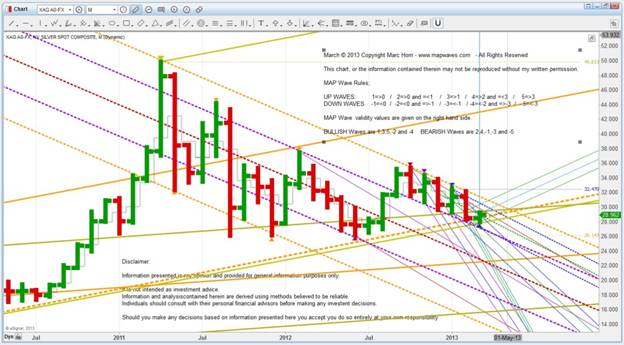
And just a quickie for those that love gold and silver. There is a huge amount of waffle written about how or why it should go up or down! Hopefully you caught the sarcasm in Massive Global Gold Price Manipulation Exposed and have a look at the outlook for silver below. God those market manipulators are good! There is indeed order to the market – it is just a matter of being able to see it!
For full updates please goto MAP Wave Analysis. Register to receive daily updates and for those adventurous ones feel free to start some discussions!
MAP Wave Analysis, unlike Elliot Wave and Andrews Pitchforks are a systematic methodical rule based approach, details of which can be found either on my blog or here on The Market Oracle and data is archived and updated in a format that is traceable as shown in this SPX update, so that the system can be improved and used as a learning model. Additionally investors can evaluate its effectiveness when making investment decisions.
Click here to follow your duty of Use and copyright is described therein.:
Probabilities are derived from the MAP Analysis methodology described therein,
Click follow on my blog to receive regular FREE market updates and discussion.
For other articles published click here
For more information of how I do what I do http://mapportunity.wordpress.com/ . Comments and discussions very welcome! The statements, opinions and analyses presented in this site are provided as educational and general information only. Opinions, estimates, buy and sell signals, and probabilities expressed herein constitute the judgment of the author as of the date indicated and are subject to change without notice. Nothing contained in this site is intended to be, nor shall it be construed as, investment advice, nor is it to be relied upon in making any investment or other decision. Prior to making any investment decision, you are advised to consult with your broker, investment advisor or other appropriate tax or financial professional to determine the suitability of any investment.
© 2013 Copyright Marc Horn - All Rights Reserved Disclaimer: The above is a matter of opinion provided for general information purposes only and is not intended as investment advice. Information and analysis above are derived from sources and utilising methods believed to be reliable, but we cannot accept responsibility for any losses you may incur as a result of this analysis. Individuals should consult with their personal financial advisors.
© 2005-2022 http://www.MarketOracle.co.uk - The Market Oracle is a FREE Daily Financial Markets Analysis & Forecasting online publication.