Definitive Proof The Stock Market Bear Is Alive And Well
Stock-Markets / Stocks Bear Market Mar 11, 2008 - 11:15 AM GMTBy: Captain_Hook
 Well – so much for follow through. With the increase in volume in the stock market rally on Wednesday, yesterday's sell-off was a bit surprising, especially combined with the fact it was on declining volume. As mentioned yesterday however, price managers need to keep equities low going into the Fed meeting on March 11 th to justify more rate cuts, so it's not surprising to see the rally fail from this perspective. What more, it's important to note that not only do nominal rates need to fall further in aiding a failing credit cycle, but real rates need to fall more as well, meaning commodities need to cool off.
The following is an excerpt from commentary that originally appeared at Treasure Chests for the benefit of subscribers on Friday, February 22 nd , 2008
Most refuse to come to grips with this realization because it will risk perceived stagflation , but the fact of the matter is real rates will not get to needed levels until commodities begin falling, where the longer this is delayed, the greater the long-term damage. Some would say it was the news that caused stocks to fall yesterday, but if you believe this, consider yourself in the naïve camp. Nothing fazes traders today, especially those using ‘other people's money' (OPM), and even worse, those guaranteed an endless free supply from the Fed. (i.e. bank and brokerage traders who are told to support both their own issues and the broads via index futures.)
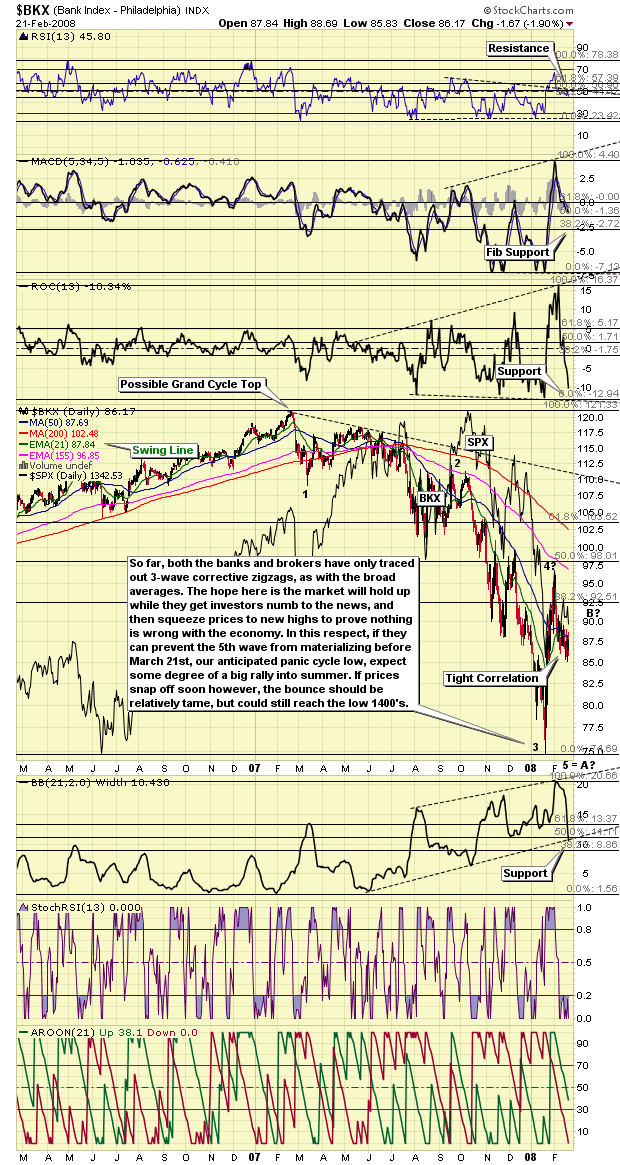
And these traders have been doing a miraculous job of painting the tape in spite of a continual supply of bad news hitting the wires everyday. What's more, if they are successful in preventing fifth-wave extensions in the larger bearish sequence running into our anticipated Martin Armstrong Pi Cycle low in and around March 21 st , they are attempting to make it appear a relatively robust bounce into summer should be considered likely. This is why Dave has the bounce going into the 1450 area, which would satisfy this condition; along with the fact such a rally would be a lie in relation to true fundamentals, meaning it shouldn't go higher. Here, once all the shorts are squeezed out, the party would be over. It's not like just after World War II in 1948 (see Figure 3 ) with all the Doe Boys coming home to fuel the economy, so short of all out hyperinflation new highs should be viewed as unlikely.
At least that's the thinking right now, where it should be pointed out that as far as Wall Street is concerned, they can keep things inflated indefinitely with all the accounting shenanigans and monetary largesse. Just take a look at what they wish us to believe with respect to the total capitalization on the New York Stock Exchange (NYSE) at present, hitting new fresh highs in spite of the fact the composite is down some 10-percent since October, and looking quite toppy (i.e. head and shoulders pattern) to say the least. (Note: I will do separate commentary on the NYA over the weekend that will clear up any uncertainty as to the future direction of the stock market, which is definitely down from here if my analysis is correct.) Of course the picture bankers and brokers wish you to see is quite different from this one, one of uncertainty about the future direction of stocks, with the potential of a short squeeze very real and omnipresent. (See Figure 1)
Figure 1

So, the question arises, ‘if bankers and brokers are bound and determined to thwart the bear, is there any information / change that could appear over the next few weeks that would cause stocks to drop in a fifth-wave extension?' Besides the fact the Fed needs subdued equities going into the next official rate decision with commodities going through the roof, which in theory should keep prices contained until then, a surprise out of Asia, and more specifically Chinese banks, related to the credit crunch may do it. Asian banks have been very quite in this regard, but they will need to come clean in March when filing annual reports, so some surprises should be on the way considering they were big buyers of US junk paper in recycling all those trade related dollars over the past few years.
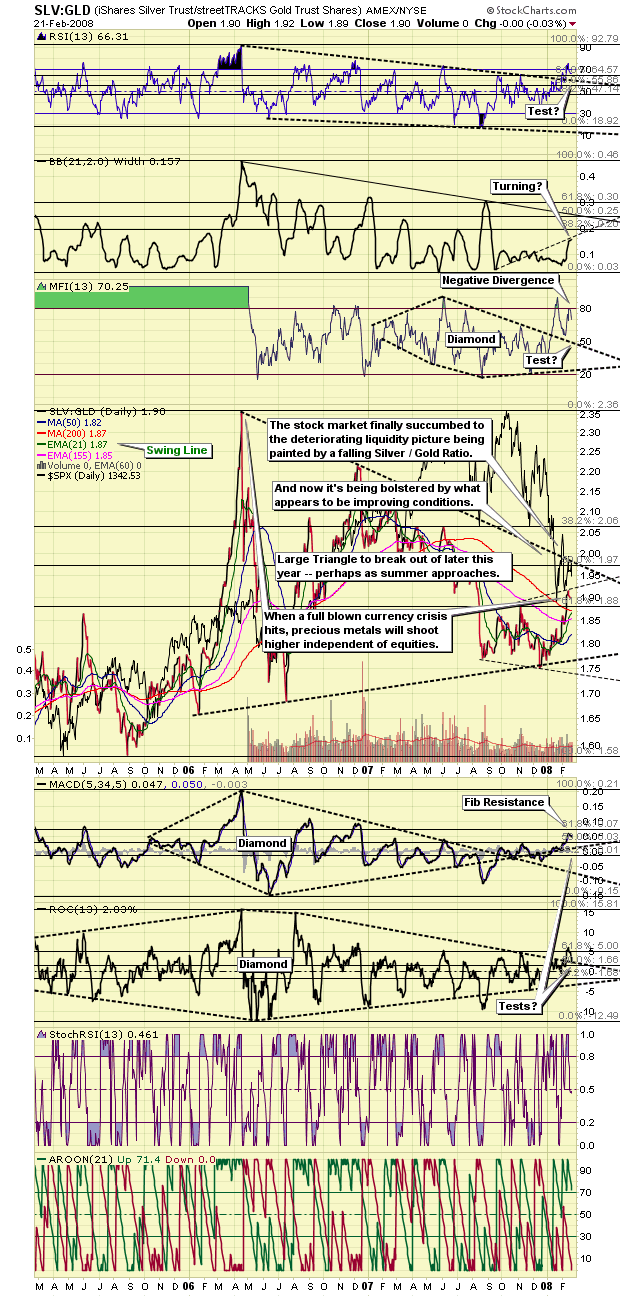
In knowing this, the next question one should ask is ‘how will we know when the next leg down in prices to reflect a now ‘global credit crunch' is in the works?' Answer: When gold begins outperforming silver again, which would be marked by a move through the 21-day exponential moving average (EMA) on the Silver / Gold Ratio (See Figure 2)
Figure 2

You see silver is traded like an industrial commodity by price managers to trivialize it, with the idea of diminishing it with respect to being alternative currency. That's why it trades stronger when the larger equity complex is rising, to reflect it's higher demand set against diminishing demand for gold with falling currency debasement rates presumed in times of economic expansion. So, with internals [Money Force Index (MFI)] in the iShares Silver Trust (SLV) / streetTracks Gold Trust (GLD) Ratio (see above) showing a negative divergence to prices that may need to be worked off in coming weeks, now appears to be as good a time as any. Combine this with the fact US indexes traced out bearish five-wave patterns on short time interval measures yesterday, and if the 21-day EMA in the SLV / GLD Ratio is crossed on the downside in coming days, the rout could be quite significant as the lights come on for the dreamers, possibly marked by increasing volume.
What if this doesn't materialize, and price managers are able to engineer (swindle) a rally in coming days? As stated above, based on the wave count in the New York Composite (NYA), and as long as Elliott Wave analysis is still valid, while price managers could always engineer a small and fleeting rally in coming days as they squeeze the shorts and put buyers, stocks should be heading lower both intermediate and longer term from here. In fact, if my eyes do not deceive me, where you will be able to make up your own mind once the pictures are presented, prices could head a lot lower from here if the head and shoulders pattern in the trade is triggered. Here, the important thing to realize is although the count on the S&P 500 (SPX) appears to be only three-waves so far, in looking at the NYA, which is the measure of all stocks on the NYSE, you can see this is a false picture, where in fact the January low completed a five-wave pattern, where yesterday could have marked the top of the corrective sequence that follows such a fall.
Unfortunately we cannot carry on past this point, as the remainder of this analysis is reserved for our subscribers. However, if the above is an indication of the type of analysis you are looking for, we invite you to visit our newly improved web site and discover more about how our service can help you in not only this regard, but on higher level aid you in achieving your financial goals. For your information, our newly reconstructed site includes such improvements as automated subscriptions, improvements to trend identifying / professionally annotated charts , to the more detailed quote pages exclusively designed for independent investors who like to stay on top of things. Here, in addition to improving our advisory service, our aim is to also provide a resource center, one where you have access to well presented ‘key' information concerning the markets we cover.
On top of this, and in relation to identifying value based opportunities in the energy, base metals, and precious metals sectors, all of which should benefit handsomely as increasing numbers of investors recognize their present investments are not keeping pace with actual inflation, we are currently covering 68 stocks (and growing) within our portfolios . This is yet another good reason to drop by and check us out.
And if you have any questions, comments, or criticisms regarding the above, please feel free to drop us a line . We very much enjoy hearing from you on these matters.
Good investing all.
By Captain Hook
http://www.treasurechestsinfo.com/
Treasure Chests is a market timing service specializing in value-based position trading in the precious metals and equity markets with an orientation geared to identifying intermediate-term swing trading opportunities. Specific opportunities are identified utilizing a combination of fundamental, technical, and inter-market analysis. This style of investing has proven very successful for wealthy and sophisticated investors, as it reduces risk and enhances returns when the methodology is applied effectively. Those interested in discovering more about how the strategies described above can enhance your wealth should visit our web site at Treasure Chests
Disclaimer: The above is a matter of opinion and is not intended as investment advice. Information and analysis above are derived from sources and utilizing methods believed reliable, but we cannot accept responsibility for any trading losses you may incur as a result of this analysis. Comments within the text should not be construed as specific recommendations to buy or sell securities. Individuals should consult with their broker and personal financial advisors before engaging in any trading activities, as we are not registered brokers or advisors. Certain statements included herein may constitute "forward-looking statements" with the meaning of certain securities legislative measures. Such forward-looking statements involve known and unknown risks, uncertainties and other factors that may cause the actual results, performance or achievements of the above mentioned companies, and / or industry results, to be materially different from any future results, performance or achievements expressed or implied by such forward-looking statements. Do your own due diligence.
Copyright © 2008 treasurechests.info Inc. All rights reserved.
Unless otherwise indicated, all materials on these pages are copyrighted by treasurechests.info Inc. No part of these pages, either text or image may be used for any purpose other than personal use. Therefore, reproduction, modification, storage in a retrieval system or retransmission, in any form or by any means, electronic, mechanical or otherwise, for reasons other than personal use, is strictly prohibited without prior written permission.
Captain Hook Archive |
© 2005-2022 http://www.MarketOracle.co.uk - The Market Oracle is a FREE Daily Financial Markets Analysis & Forecasting online publication.


