Stock Market S&P Bear Calls Have ALL Missed
Stock-Markets / Stock Markets 2013 Apr 07, 2013 - 06:44 PM GMTBy: Michael_Noonan
 Salivating Bears have been calling for a market top for over 4 years, now, and none have been right. The sentiment is understood but misplaced. This goes to show how markets are not predictable, but people are. So many want to exercise the FILO inventory premise: First In Last Out. It is so difficult to check egos at the door for there is a huge difference in being right and being profitable.
Those who choose to be right often find themselves on the loosing end. Those who choose to be profitable always have a game plan. Game plans rarely pick tops or bottoms, the most unprofitable areas for trading. The best source for market information comes from the market itself, and from what we can see, there has been no indication that a top has formed. It is possible the market is getting there, but getting there and being there are not the same. Always to stick to a proven game plan.
The message of the market is best viewed from the charts, and we are using the E-Mini.
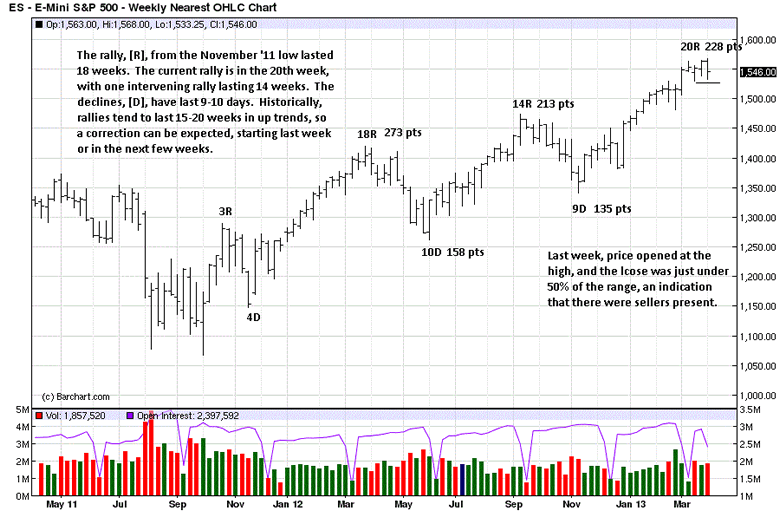
An associate of ours has observed that market rallies tend to last 15-20 weeks, and the current rally is in week 20. A correction, of some sort, is now due, this week, next week, it cannot be known until it happens, but the Time factor is ever-present.
Last week was an OKR, [Outside Key Reversal], defined by a higher high and lower low from the preceding week, and in this one, a lower close, [the close can higher, lower or unchanged]. The word "Reversal" provides a clue as to near term expectations. Not ours, necessarily, but as in the acronym, OKR.
The one factor outweighing the rest is the trend, and the trend for stocks is up. Trends tend to persist, and it takes time to turn one around. Time equates to patience, and it is patience that is the undoing of a great many traders. There have been so many calling for a top, as we have observed from comments and expectations over the last 4 years.
In an up trend, demand is already a proven factor. It is supply, or sellers who bear the burden of proof for making a change, and that has not yet happened. The groundwork already exists for a correction, but it is impossible to know, in advance, if it will be a normal correction, and lately, they have been 9-10 days in duration, or if it will signal the potential of a topping formation.
Identifying the trend as up does not mean one should not be cautious or unprepared for a market turn, but the caution would be in the form of taking profits and/or using close stops. It does not mean going short. Even the 2008 market top took a few months to develop.

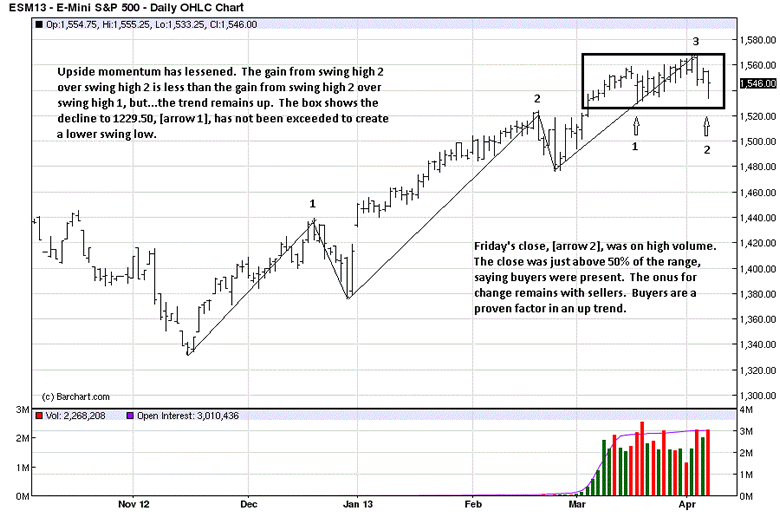
Upside momentum has lost a few steps in the current rally. In the rally leading to swing high 2, note how the bars were steadily higher. In the current rally, the bars have been higher, but mostly overlapping. When bars overlap, it indicates a greater struggle between buyers and sellers, but so far, buyers have prevailed.
The bulk of the rally to swing high 3 began when price broke above swing high 2, at the beginning of March. The high of 2 has been support, seen at arrow 1. Friday's decline is still above that price, 1529 area, and the entire box area is above 2, which is a bullish sign. It may not hold, but until that event occurs, we can only judge the market by the facts as they presently exist.
Friday's sell-off closed above the half-way point of the range, and that tells us buyers are still actively present, even if the buyers are only the Fed. If sellers were in control, the close would have been lower. Based on the trend, we could be looking at an opportunity to buy on Monday.

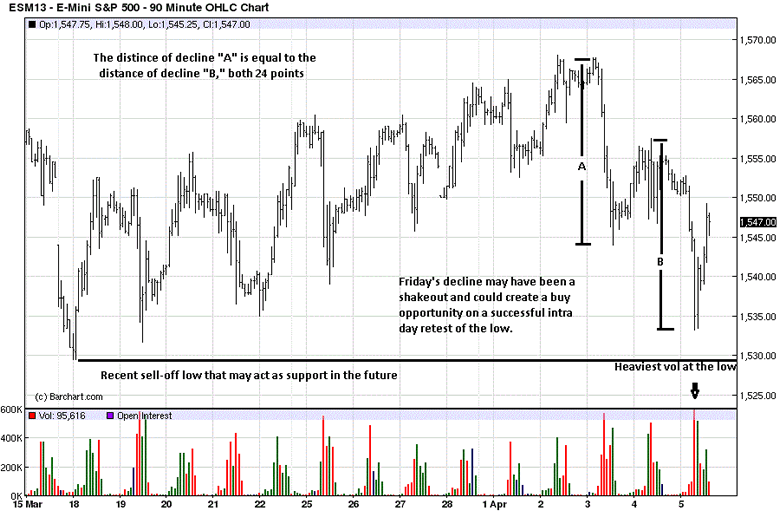
The 1529.50 low of 15 March is likely to offer support on a future retest, horizontal line extending to the right. This makes Friday's low very interesting. One measure Connie Brown, Aerodynamic Investments, uses is equality between swings. The decline of "A" was 24 points, as was the decline of "B." Based on this, at least a reaction can be expected, at a minimum. [Never forgetting "Anything Can Happen" in markets, it can also fail.]
The highest volume occurred at the low, and that begs the question, who do you think creates volume? The short answer is what we like to call "smart money." The public tends to follow, not lead. The Friday low is above the 15 March support, telling us if sellers were in charge, why couldn't they press the market lower and take advantage of their selling momentum? Maybe because sellers do not have the momentum.
The reaction off the high volume low was immediate and to the upside. If we see a light volume pull-back on Monday, with smaller intra day ranges, it could offer a low-risk buy. As was stated in the opening second paragraph, having a game plan is essential to being profitable. It is not a guarantee for profit on every trade, but the consistency in application is a winning combination.
Developing market activity is always the most reliable source for information and the best guide.

By Michael Noonan
Michael Noonan, mn@edgetraderplus.com, is a Chicago-based trader with over 30 years in the business. His sole approach to analysis is derived from developing market pattern behavior, found in the form of Price, Volume, and Time, and it is generated from the best source possible, the market itself.
© 2013 Copyright Michael Noonan - All Rights Reserved Disclaimer: The above is a matter of opinion provided for general information purposes only and is not intended as investment advice. Information and analysis above are derived from sources and utilising methods believed to be reliable, but we cannot accept responsibility for any losses you may incur as a result of this analysis. Individuals should consult with their personal financial advisors.
Michael Noonan Archive |
© 2005-2022 http://www.MarketOracle.co.uk - The Market Oracle is a FREE Daily Financial Markets Analysis & Forecasting online publication.


